
Figures & data

Table 1 Comparison Of 3 OCT-A Devices
Table 2 Patient Demographic Information And Chorioretinal Disease Diagnosis
Figure 1 SCP images and segmentation using Optovue RTVue-XR, Topcon DRI-OCT Triton Swept-Source OCT, and Zeiss Cirrus 5000-HD-OCT Angioplex.
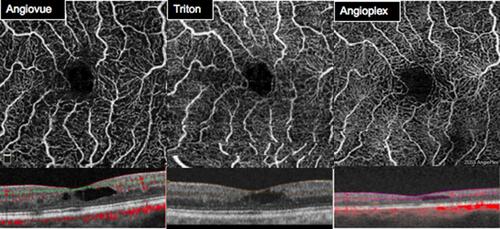
Figure 2 SCP images after binarization using the Niblack automated local thresholding method.
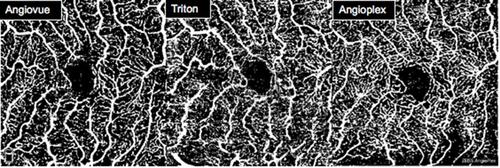
Figure 3 (A) Bland-Altman plot showed agreement between the two investigators for the SCP FAZ area measurements. (B–D) Bland-Altman plot showing the level of agreement between FAZ area measurements for devices. (B) Triton vs Angiovue. (C) Triton vs Angioplex. (D) Angiovue vs Angioplex.
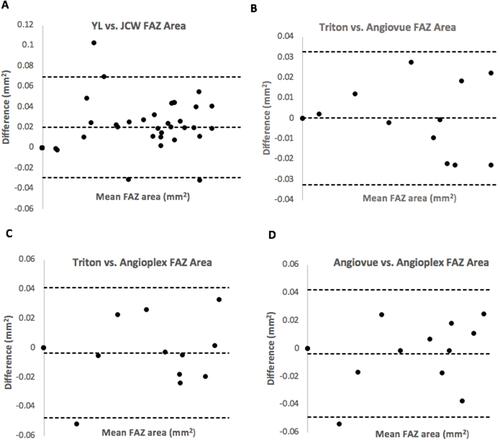
Table 3 SCP FAZ Measurements And ICC
Table 4 SCP And DCP VD Measurements With Respect To Individual Devices From Binarized Images Using The Niblack Automated Local Thresholding Method
Table 5 Post Hoc Comparisons Of SCP VD, DCP VD, And FAZ