
Figures & data
Figure 1 (A) A low vision person using Aira to connect to an (B) agent who is using a software dashboard comprised of the wearable device’s live video stream, as well as additional applications that assist with task coordination.
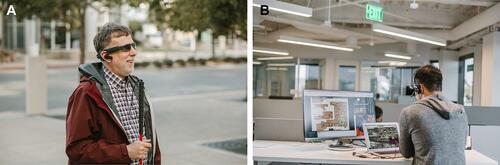
Figure 2 Distribution of categories by task success rate.
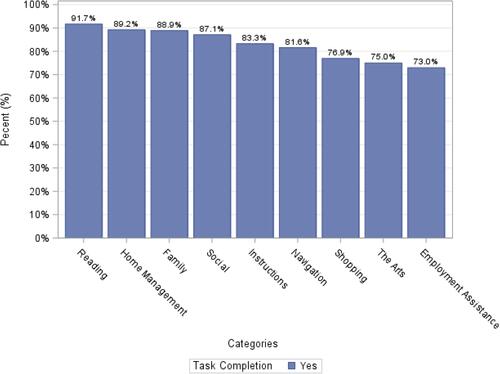
Figure 3 Distribution of call categories by gender.
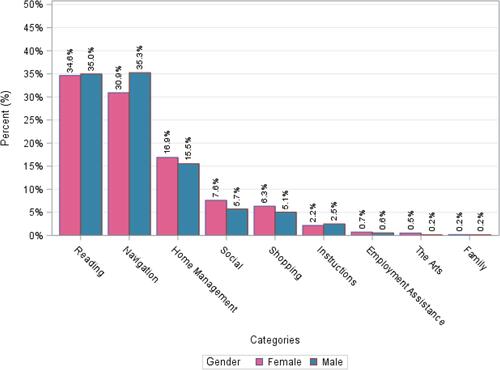
Figure 4 Call duration by gender.
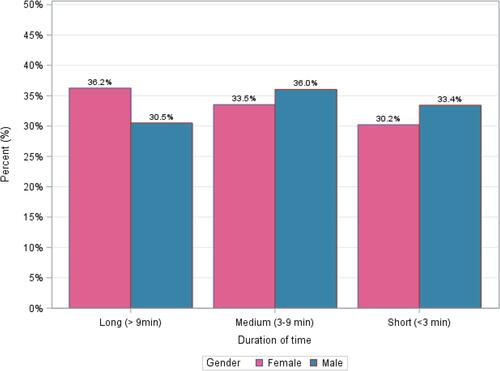
Figure 5 Call time of day by gender.
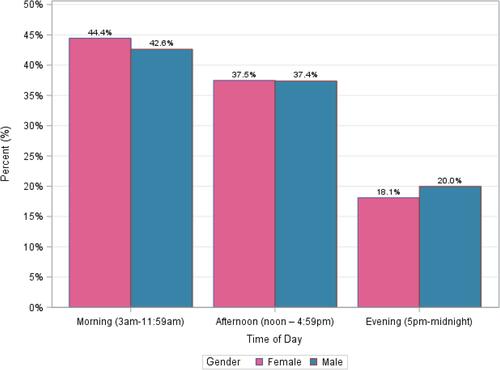
Figure 6 Call day of week by gender.
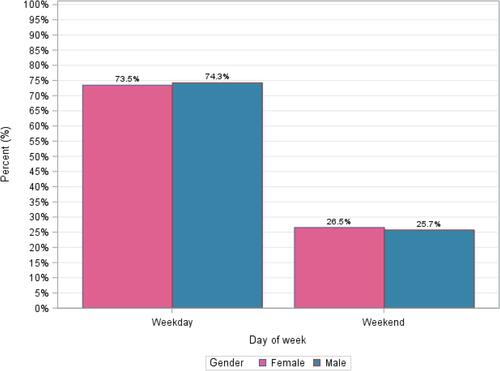
Figure 7 Distribution of call categories by vision status.
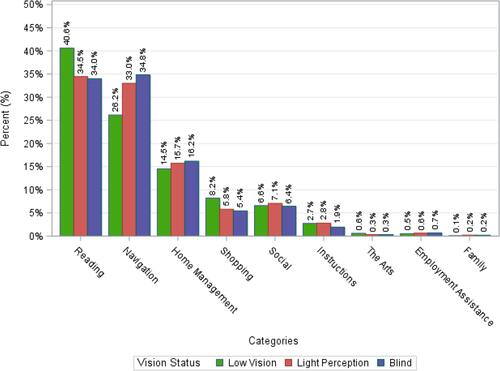
Figure 8 Call duration by vision level.
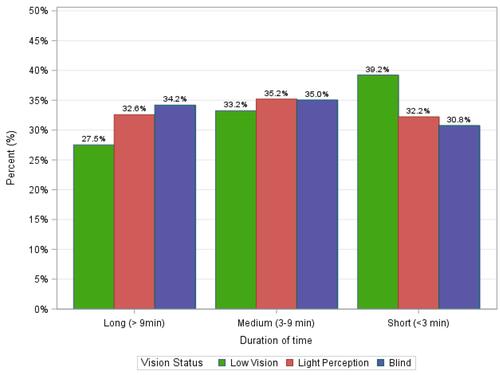
Figure 9 Call time of day by vision level.
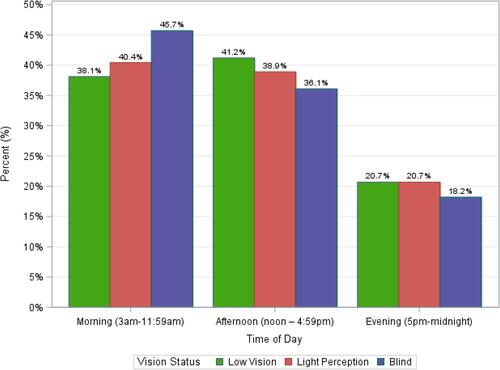
Figure 10 Call day of week by vision level.
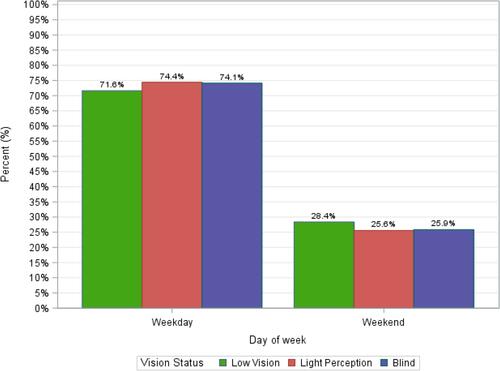
Table 1 Number of calls by gender
Table 2 Number of calls by vision status
Table 3 Number of calls by gender and vision status
Table 4 Poisson regression to estimate the usage rates by gender and vision status
Figure 11 Number of calls by gender.
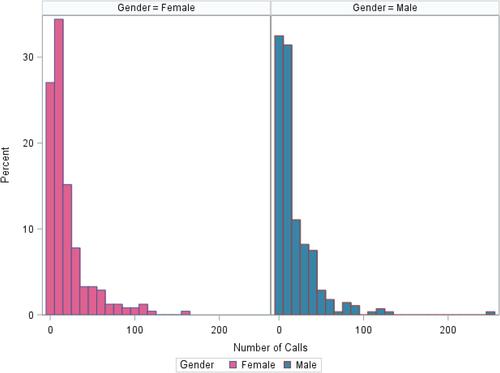
Figure 12 Number of calls by vision status.
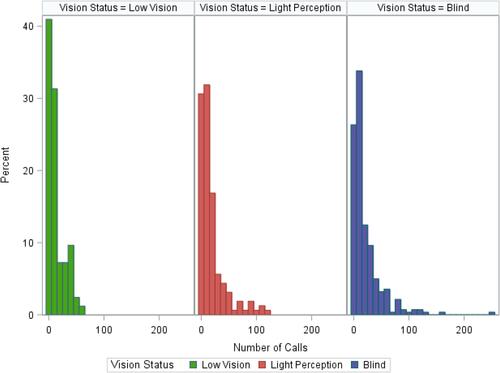
Figure 13 Number of calls by vision status and gender.
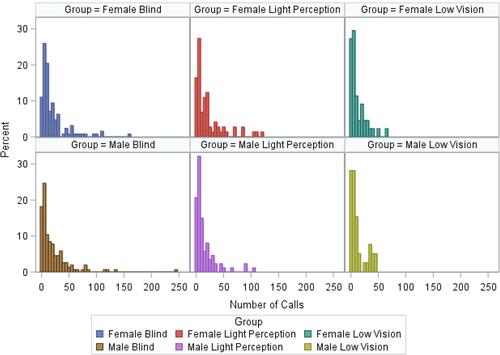
Table 5 Brief summary of currently available assistive technologies