
Figures & data
Figure 1 Implantable phakic copolymer lens over the butterfly cartridge.
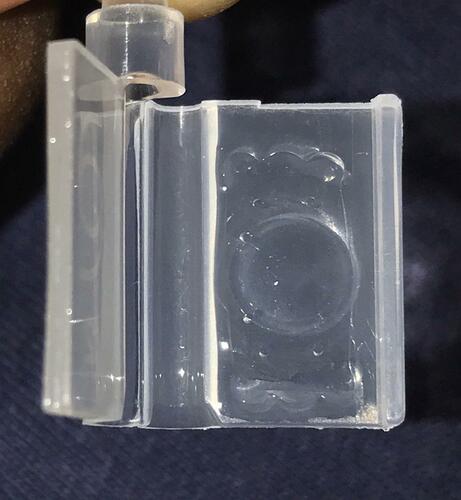
Table 1 Satisfaction scores
Figure 2 (A, B, and C) Postoperative lens position on pupillary dilatation in slit lamp.
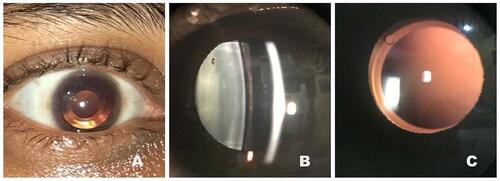
Table 2 Patient demographics and visual acuity (N-75)
Figure 3 (A) Comparative analysis between preoperative best-corrected visual acuity and postoperative uncorrected visual acuity. (B) Postoperative residual refractive power in diopters. (C) Visual Gain in postoperative period compared to preoperative best-corrected visual acuity. (D) Scatter plot of vault height assessed by anterior segment OCT (Zeiss Inc., Jena).
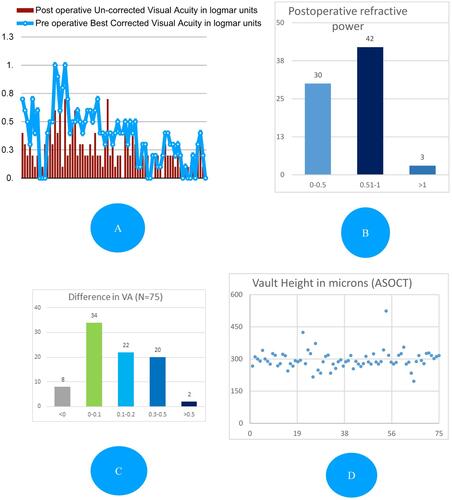
Figure 4 Satisfaction scores of the patients.
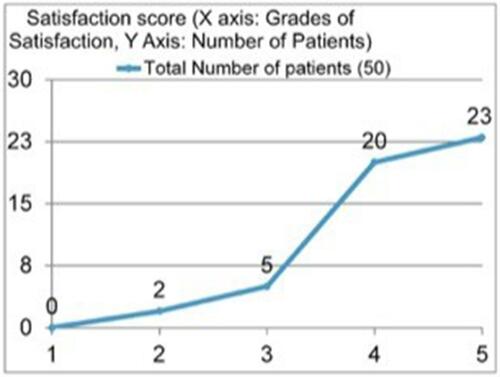
Table 3 Complications