
Figures & data
Table 1 Characteristics of the study population
Figure 1 Boxplot of intraocular pressure (IOP) of right eye (OD) for each group.
Notes: The graph shows the IOP (Y) in each group (X). It is shown that group 1 had higher IOP than group 2, which had higher IOP than group 3. Group 1: control group. Group 2: patients with controlled HIV disease. Group 3: patients with uncontrolled HIV disease.
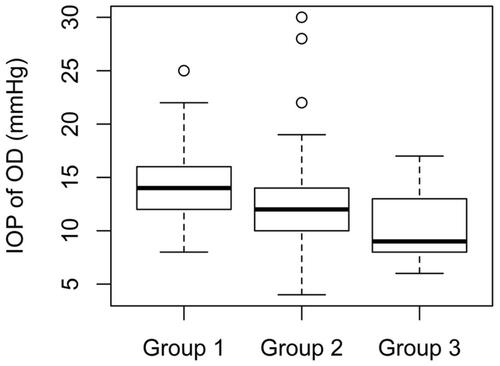
Figure 2 Probability density function of the intraocular pressure (IOP) of right eye (OD) variable.
Notes: In the graph, the Y coordinate shows the density and the X coordinate shows the IOP. Group 1: control group. Group 2: patients with controlled HIV disease. Group 3: patients with uncontrolled HIV disease.
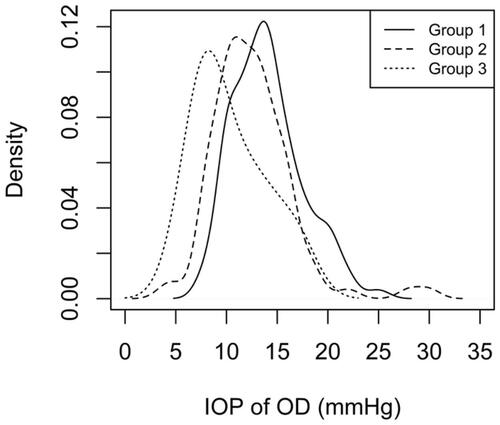
Figure 3 Tukey test–95% family-wise confidence level.
Notes: The graph shows, for each combination of groups, the value of the difference between the means and their respective 95% CI. The vertical dashed line indicates the point where the difference between the means is equal to zero, that is, the means are equal. It is important to note that in the comparison between groups 1–2 and groups 1–3, the vertical line does not cut the 95% CI. The same does not occur between groups 2 and 3. Group 1: control group. Group 2: patients with controlled HIV disease. Group 3: patients with uncontrolled HIV disease.
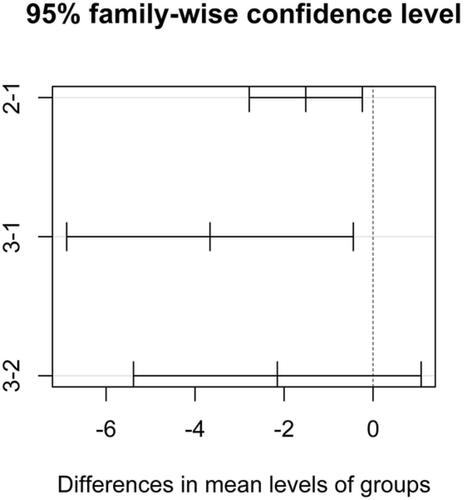
Table 2 Stepwise odds ratio of HIV groups and the relation with optic disc excavation and pachymetry of right eye