Figures & data
Figure 1 Three CT techniques for proptosis estimation. (A) Method 1: A line is drawn between the lateral orbital rims on the section that bisects the lens. B line is drawn between A line and the posterior surface of the cornea. (B) Method 2: A line is drawn between the lateral and medial orbital rims on the same axial plane. B line is drawn between A line and the posterior surface of the cornea. (C) Method 3: A line is drawn between the superior and inferior orbital rims on the sagittal plane. B line is drawn between A line and the posterior surface of the cornea.
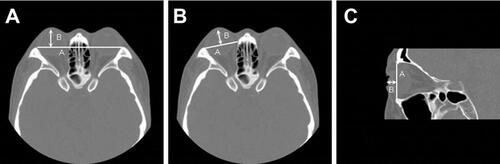
Table 1 Baseline characteristics and mean hertel exophthalmometry
Table 2 Exophthalmometric values of hertel exophthalmometry and CT techniques
Figure 2 Association between Hertel and CT techniques by Pearson’s correlation analysis. The correlation between Hertel and CT method 1 is shown in (A), CT method 2 in (B), and CT method 3 in (C). Pearson’s (r) was 0.727 (A), 0.712 (B), and 0.623 (C).
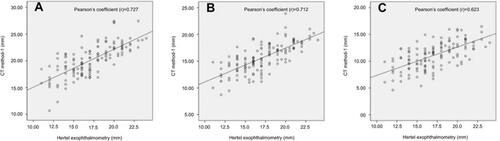
Table 3 Mean eye proptosis differences of Hertel and CT techniques (mm)
Table 4 Correlation analysis between Hertel and CT techniques (proptosis difference ≤2.0 mm, N=110)
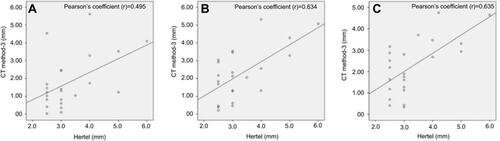
Figure 3 Association between Hertel and CT techniques (proptosis difference >2 mm) by Pearson’s correlation analysis. The correlation between Hertel and CT method 1 was (A), CT method 2 was (B), and CT method 3 was (C) (proptosis difference >2 mm). Pearson’s (r) was 0.495 (A), 0.634 (B), and 0.635 (C).