Figures & data
Table 1 Detection rate of abnormal points in each test point
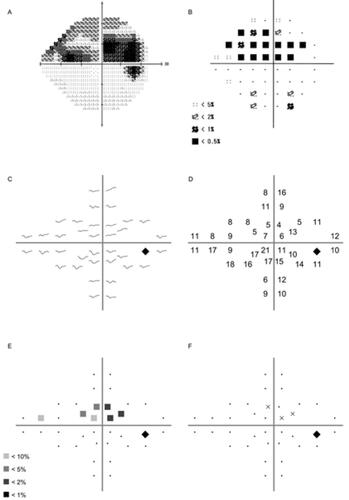
Figure 1 Measured results of glaucoma patient (67-years male, primary open-angle glaucoma, Mean deviation –8.90 dB, Pattern standard deviation 8.83 dB, Visual field index 74%). (A) Gray scale of Humphrey Field Analyzer (HFA), (B) Pattern deviation of HFA, (C) Pupil waveforms, (D) Percentage pupil constriction (%), (E) Pattern deviation (■25% black; P<10%, ■50% black; P<5%, ■75% black; P<2%, ■100% black; P<1%), (F) Subjective response (It can be simultaneously recorded if the patient pushes a button).