Figures & data
Table 1 Descriptive data of patients in the three ACD groups
Table 2 Mean refractive prediction error, mean absolute error and median absolute error of each formula in three groups
Table 3 Percentage of eyes with refractive prediction errors within ±0.25 D, ±0.50 D, ±1.00 D, and ±2.00 D in Group 1 (ACD less than 2.4 mm)
Table 4 Percentage of eyes with refractive prediction errors within ±0.25 D, ±0.50 D, ±1.00 D, and ±2.00 D in Group 2 (ACD between 2.4 and 2.9 mm)
Table 5 Percentage of eyes with refractive prediction errors within ±0.25 D, ±0.50 D, ±1.00 D, and ±2.00 D in Group 3 (ACD greater than 2.9 mm)
Figure 1 Correlation of anterior chamber depth with refractive prediction error for the Barrett Universal II and Haigis formulas.
Abbreviations: ACD, anterior chamber depth; RPE, refractive prediction error.
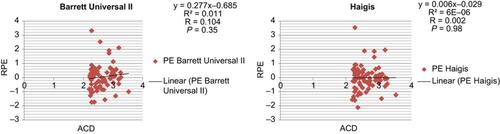
Figure 2 Correlation of anterior chamber depth with refractive prediction error for the Hoffer Q, Holladay 1, and Holladay 2 formulas.
Abbreviations: ACD, anterior chamber depth; RPE, refractive prediction error.
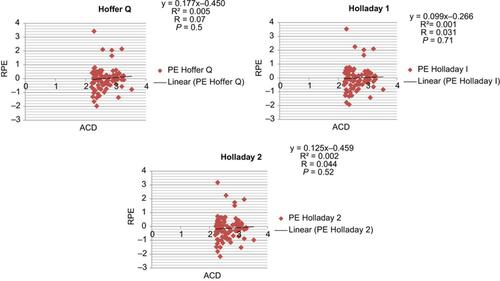
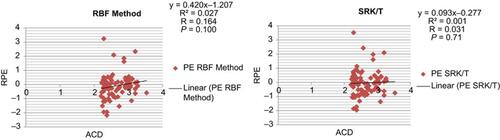
Figure 3 Correlation of anterior chamber depth with refractive prediction error for the RBF Method and SRK/T formulas.
Abbreviations: ACD, anterior chamber depth; RPE, refractive prediction error.