Figures & data
Table 1 Demographics of the four groups
Figure 1 Higher order aberrations in each group.
Note: *P < 0.05 compared with AT group.
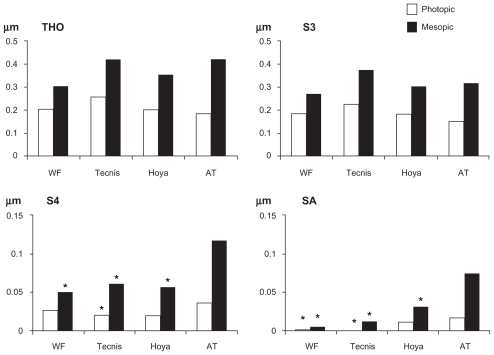
Figure 2 Depth of focus in each group.
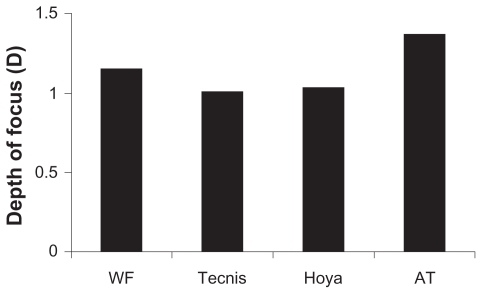
Table 2 Contrast sensitivity and AULCSF in each group
Table 3 Correlation coefficients and P value of Pearson’s correlation analysis between higher-order aberrations, pupil diameter, contrast sensitivity function, and AULCSF in all eyes (n = 120)