
Figures & data
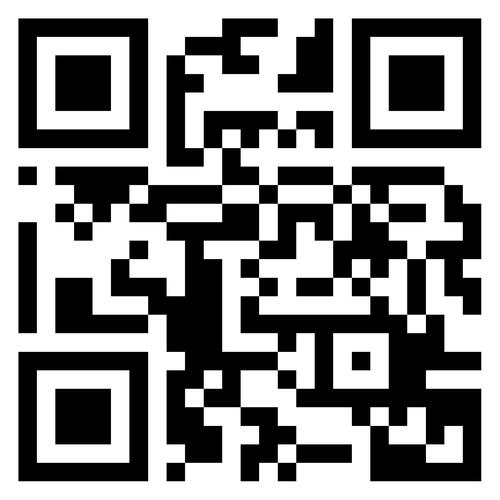
Figure 1 Sector plot of the etiology of limbal stem cell deficiency. The corresponding percentages for each group are shown. Each etiology is represented with a different color.
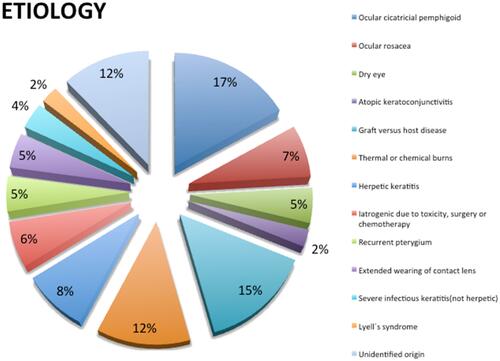
Figure 2 Bland-Altman plot of the relationship between the classical self-administered Ocular Surface Disease Index (OSDI) and the Keratograph 5M OSDI. The measures were encompassed between the mean and two standard deviations following a linear pattern, demonstrating that the results of the two tests were very similar.
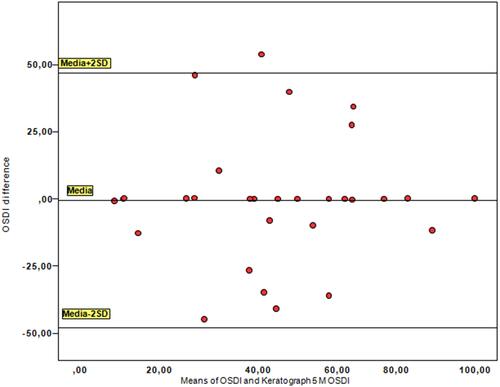
Figure 3 Bland-Altman plot of the relationship between the keratograph noninvasive tear break-up time (NIKBUT) and tear break-up time (BUT). The two tests fit one another, forming an almost horizontal line, showing linearity. Almost all values were between the mean and two standard deviations.
Table 1 Keratograph 5M Dry Eye Level