Figures & data
Table 1 Relative value unit distributions by retinal physician subgroup
Table 2 Expense allocation schemes for direct cost departments
Figure 1 Small single-specialty group practice: percent change in procedure volume.
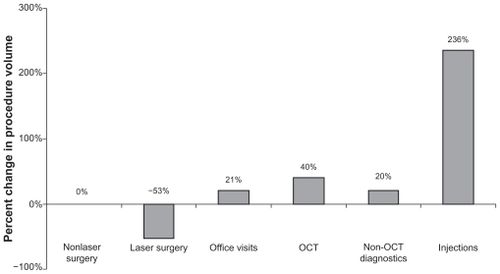
Figure 2 Small single-specialty group practice: percent change in revenue.
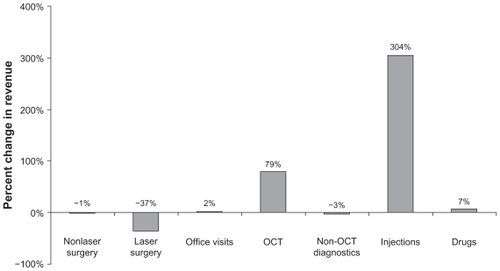
Figure 3A Small single-specialty group practice: distribution of costs by service line.
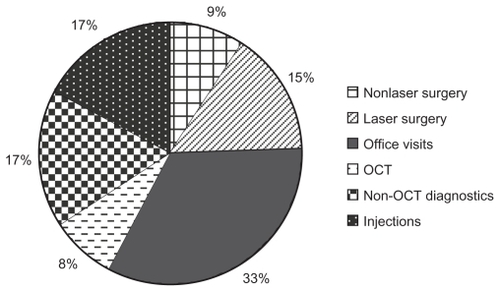
Figure 3B Small single-specialty group practice: distribution of costs by cost center.
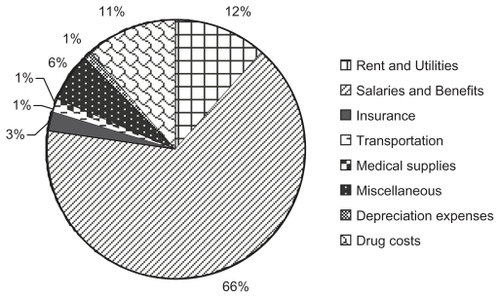
Figure 4 Small single-specialty group practice: profit margin across service lines.
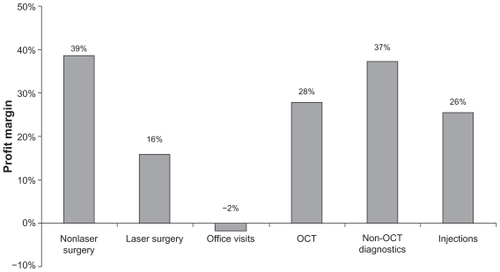
Figure 5 Academic hospital-based practice: percent change in procedure volume.
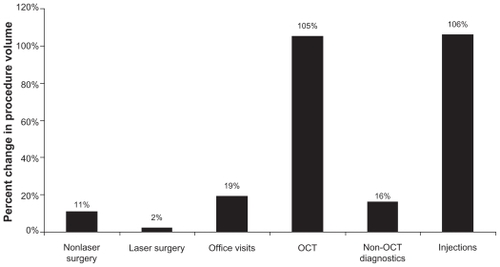
Figure 6A Academic hospital-based practice: percent change in revenue.
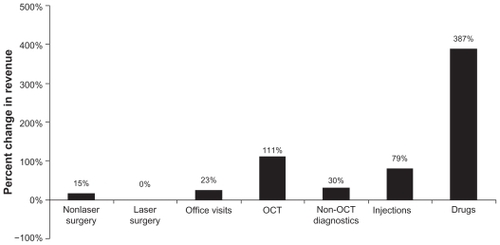
Figure 6B Academic hospital-based practice: percent change in revenue by retinal physician subgroup.
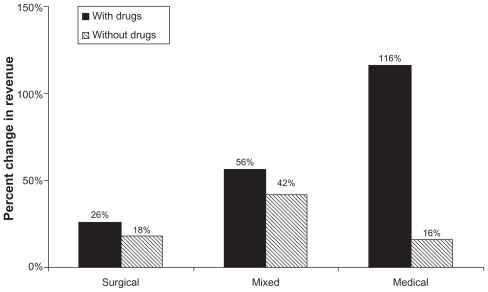
Figure 7A Academic hospital-based practice: distribution of costs by service line.
Figure 7B Academic hospital-based practice: distribution of costs by retinal physician subgroup.
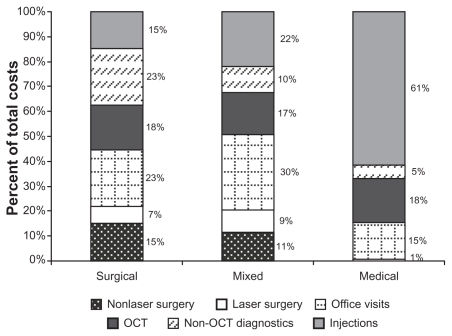
Figure 8 Academic hospital-based practice: overall profit margin across service lines.
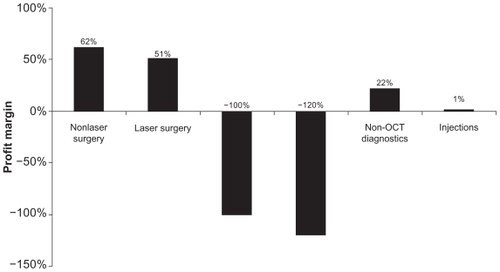
Figure 9 Medicare national physician payment for bilateral OCT and intravitreal injections between 2010 and 2011.
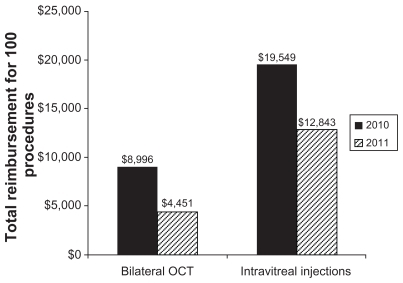
Figure 10 Average change in Medicare reimbursement between 2008 and 2011 across service lines.
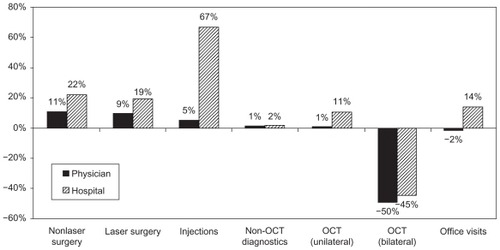
Figure 11A Mixed practice: 2008 distribution of revenue by service line.
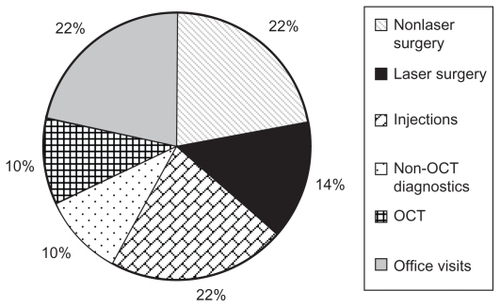
Figure 11B Mixed practice: 2011 distribution of revenue by service line (assuming OCT procedures are performed bilaterally).
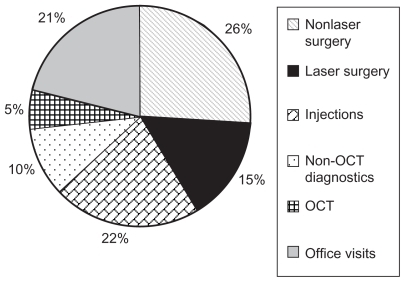
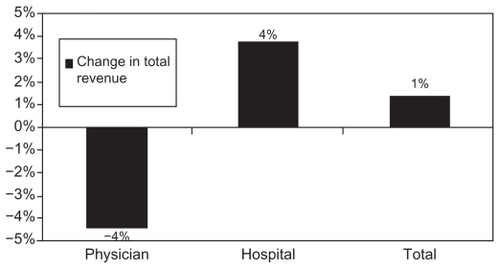
Figure 11C Mixed practice: change in total revenue between 2008 and 2011.
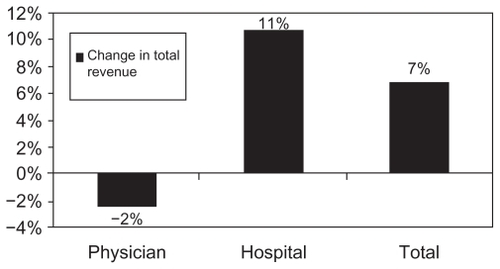
Figure 12A Surgical practice: 2008 distribution of revenue by service line.
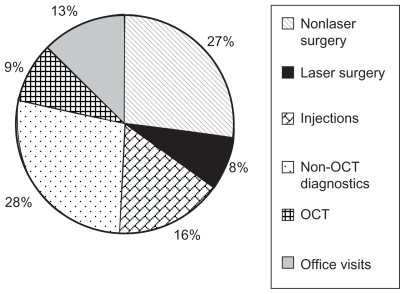
Figure 12B Surgical practice: 2011 Distribution of revenue by service line (Assuming OCT procedures are performed bilaterally).
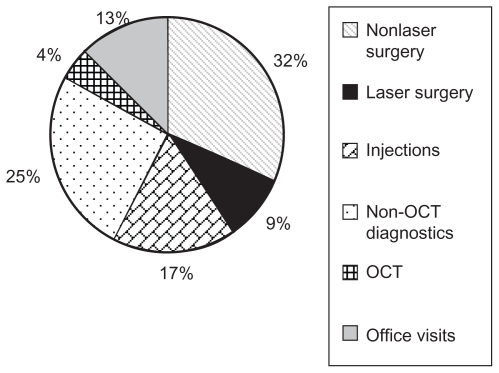
Figure 12C Surgical practice: change in total revenue between 2008 and 2011.
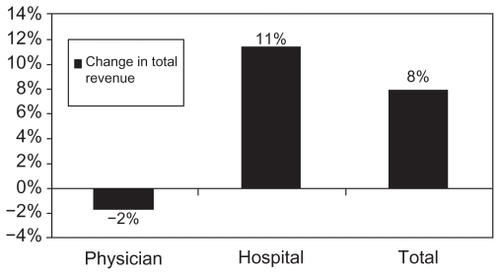
Figure 13A Medical practice: 2008 distribution of revenue by service line.
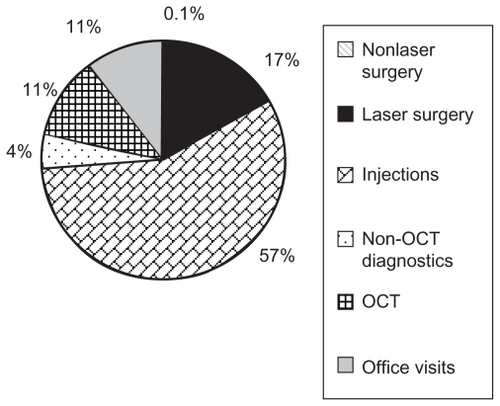
Figure 13B Medical practice: 2011 distribution of revenue by service line (assuming OCT procedures are performed bilaterally).
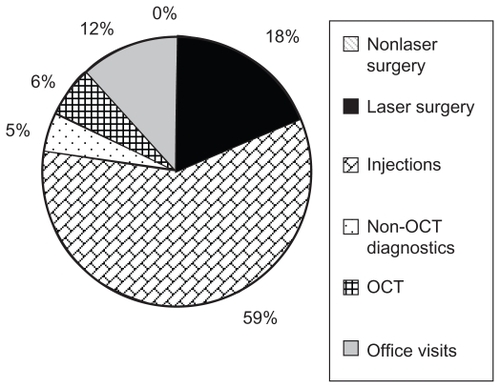
Figure 13C Medical practice: change in total revenue between 2008 and 2011.