
Figures & data
Figure 1 Infrared meibography for meibomian gland imaging. Arrows point to the glands of the lower eyelid when normal and truncated. The eyelid is everted with a Korb meibomian gland evaluator.
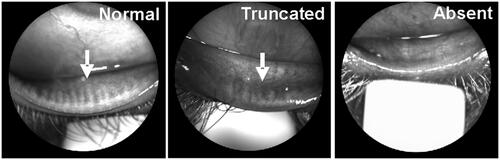
Figure 2 Range of eyelid skin pigmentation in our patient population and representative eyelid slit-lamp images with pigmentation analysis method. Yellow square approximates the area of RGB pixel analysis. Eyelid margin vascularization was identified at the lid margin (*) in downgaze images. The bottom-right image is an example of a subject in which eyelid margin vascularization is present.
Abbreviation: RGB, red/green/blue pixel analysis.
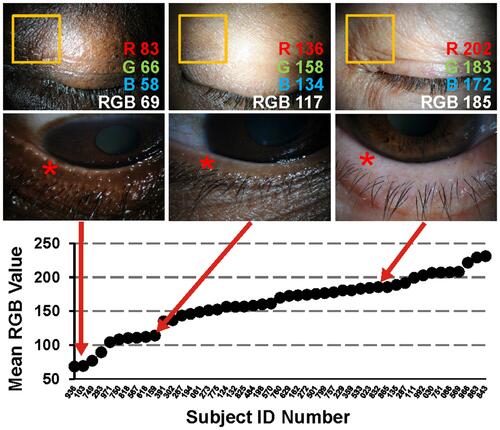
Figure 3 Eyelid pigmentation compared to other subject parameters. Other parameters evaluated include: (A) meibography score evaluating for gland truncation/dropout (normal =10); (B) Schirmer’s tear production (normal≥10 mm); (C) dry eye symptoms score using the SANDE visual analogue scale; (D) presence or absence of vascularization; (E) Meibum quality (open symbol = standard pressure applied with the Korb evaluator, solid symbol = increased pressure applied with the Korb evaluator); and (F) diagnosis of MGD.
Abbreviations: SANDE, Symptom Assessment iN Dry Eye questionnaire; RGB, red/green/blue pixel analysis; MGD, Meibomian gland dysfunction.
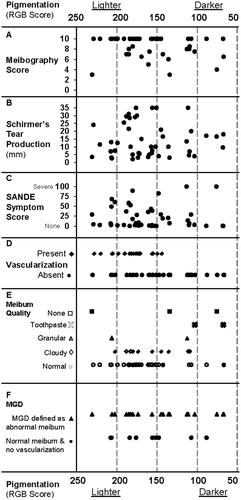
Table 1 Sensitivity and specificity of using vascularization alone to diagnose MGD in all subjects, and split around the median pigmentation