
Figures & data
Table 1 Ocular Parameters And IOL Power Statistics
Table 2 Post-Operative Refractive And Visual Results
Table 3 Subjective Impression (%)
Table 4 Comparison Between Eyes Implanted With Non-Toric And Toric Models (Mean ± SD)
Table 5 Comparison Between Males And Females (Mean ± SD)
Table 6 Comparison Between Patients Implanted Bilaterally And In One Eye Only (Mean ± SD)
Figure 1 Comparison between eyes implanted with non-toric and toric models (P>0.05).
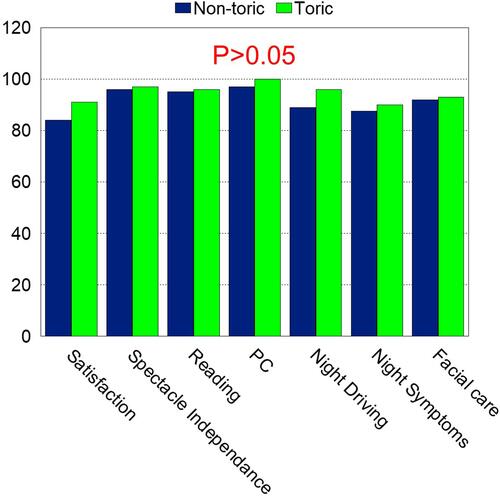
Figure 2 Comparison between males and females (P>0.05).
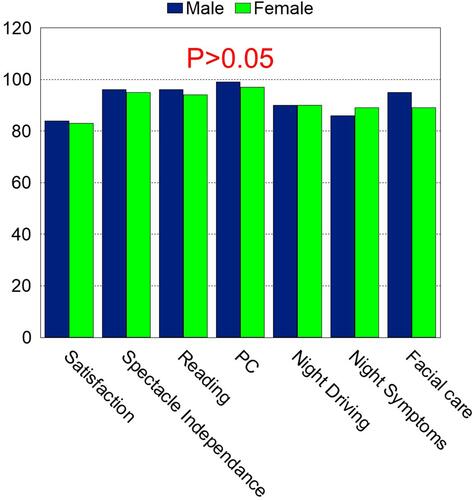
Figure 3 Comparison between patients implanted bilaterally and those implanted unilaterally (P>0.05).
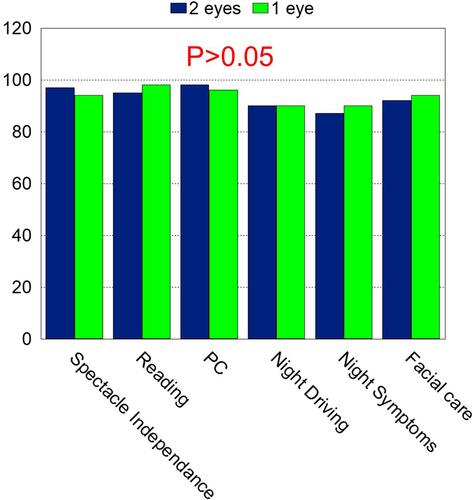
Table 7 Correlation Between Age And IOL Power From One Side And Visual Results And Subjective Performance Form The Other Side (r)