Figures & data
Table 1 Clinical Characteristics Of The Patients With RAP
Figure 1 Graph showing the changes in the mean values of the logMAR BCVA from baseline until 108 months after the first anti-VEGF injection. The difference in postinjection BCVA relative to the baseline level was maintained throughout the 36-month period but was significantly decreased from 48 months to 108 months. The upper numbers show the number of injections. The lower numbers show the number of patients who were able to be examined during the follow-up.
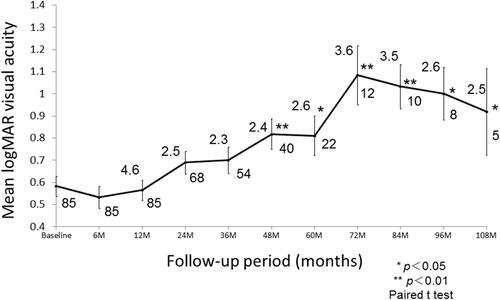
Table 2 Stepwise Multiple Regression Analysis Of The BCVA At Final Visit And Improvement Of The Visual Acuity
Figure 2 An association between complications and final visual acuity. Final BCVA was significantly influenced by the incidence of massive subretinal hemorrhage, presence/absence of fibrotic scar, and presence/absence of macular atrophy (P = 0.013, P < 0.001, and P = 0.001, respectively).
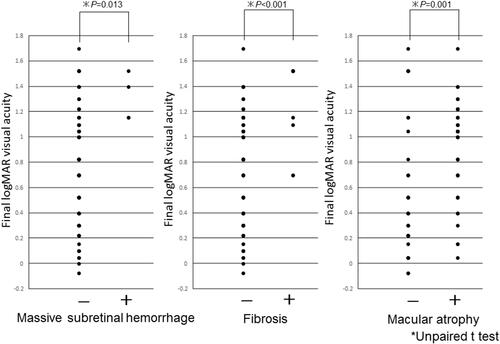
Table 3 Multiple Logistic Regression Analysis To Predict The Development Of Macular Atrophy
Figure 3 A 78-year-old woman presented with decreased visual acuity in her left eye. (A) A color fundus photograph of the left eye showing multiple soft drusen and reticular pseudodrusen. (B) Late-phase fluorescein angiographic image of the fundus showing leakage from a retinal–retinal anastomosis (white arrowhead). (C) A hot spot consistent with neovascularization is clearly identified by indocyanine green angiography. (D) SD-OCT at baseline revealing elevated PED with subretinal fluid. The visual acuity was 20/40 in the left eye, and the patient was diagnosed as having RAP stage 2 with PED. (E) In total, 6 ranibizumab injections were administered. Finally, at the 67-month follow-up examination, the patient’s visual acuity had stabilized at 20/40. (F) SD-OCT showing the remaining RPE and outer retina.
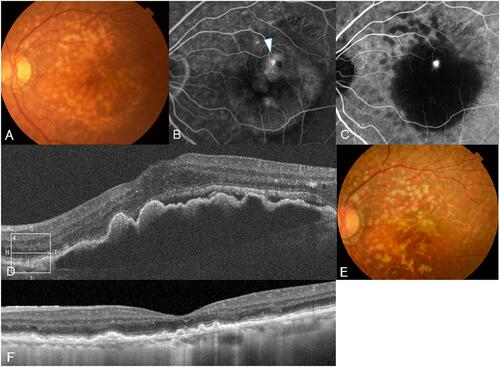
Figure 4 A 78-year-old man presented with decreased visual acuity in his right eye. (A) A color fundus photograph of the left eye showing multiple soft drusen and preretinal hemorrhage. (B) Early-phase fluorescein angiographic image of the fundus showing leakage from a retinal–retinal anastomosis and hypofluorescence consistent with hemorrhage. (C) Indocyanine green angiography showing no abnormal findings. (D) SD-OCT at baseline revealing intraretinal neovascularization without PED (white arrowhead). The visual acuity was 20/50 in the right eye, and the patient was diagnosed as having RAP stage 1. (E) In total, 36 ranibizumab injections were administered. Finally, at the 9-year follow-up examination, the patient’s visual acuity had decreased at 20/100. Macular atrophy developed. (F) SD-OCT showing the loss of RPE and outer retina.
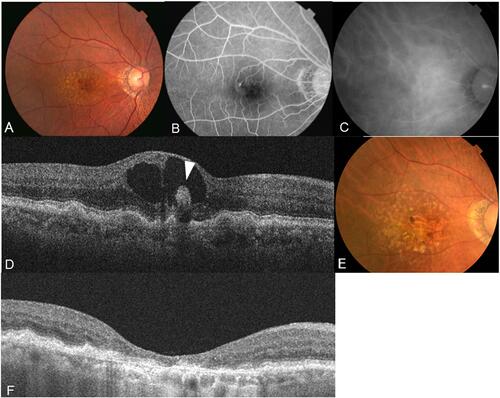
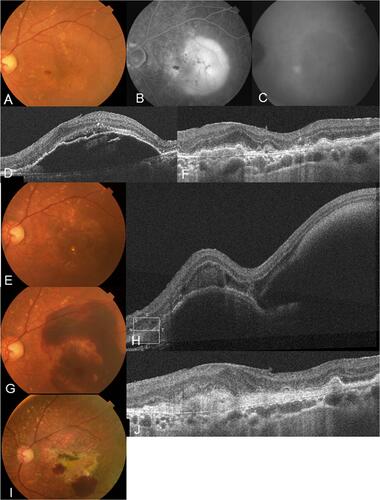
Figure 5 An 84-year-old man presented with metamorphopsia in his left eye. (A) A color fundus photograph of the left eye showing multiple soft drusen and preretinal hemorrhage with PED. (B) Late-phase fluorescein angiographic image of the fundus revealing pooling showing PED and hypofluorescence consistent with hemorrhage. (C) Hot spot consistent with neovascularization is clearly identified by indocyanine green angiography. (D) SD-OCT at baseline revealing elevated PED. The visual acuity was 20/25 in the left eye, and the patient was diagnosed as having RAP stage 2 with a PED. (E) After 15 ranibizumab injections were administered, at the 46-month follow-up, PED disappeared and visual acuity improved to 20/16. (F) SD-OCT showing an improvement in the PED. (G) However, 2 days after the 46-month check-up, massive subretinal hemorrhage developed and visual acuity declined to 20/200. (H) SD-OCT showing subretinal hemorrhage and hemorrhagic PED. (I) Finally, after an additional 30 ranibizumab injections, fibrosis with a partial small subretinal hemorrhage was observed at the 108-month follow-up. (J) SD-OCT showing fibrosis with loss of outer retina. Visual acuity decreased to 20/1000.