Figures & data
Table 1 Baseline Characteristics of Patients with Insufficient Response to Anti-VEGF Monotherapy
Table 2 Portion of Eyes with Persistent Disease Activity
Table 3 Comparison Between and Within the Groups Regarding Number of Injections Within the 12 Months Before and 12 Months After Switch
Table 4 Comparison Between and Within the Groups Regarding Interval of 12 Months Before and 12 Months After Switch
Figure 1 Central retinal thickness (CRT in μm) at the start of treatment, 3 months, 6 months, 12 months as well as 3, 6, and 12 months after switch. Black line: group 1 (n=25 eyes in 25 patients); grey line: group 2 (n= 25 eyes in 25 patients); *p ≤ 0.05. Error bars represent the standard error of the mean (SEM).
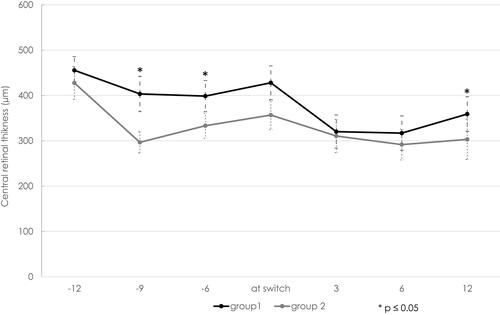
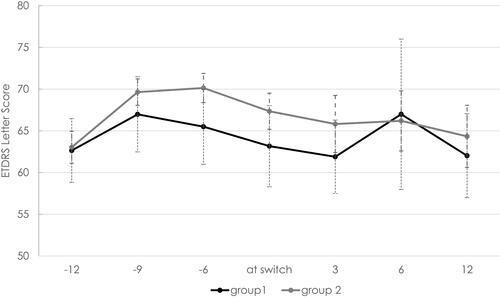
Figure 2 Best-corrected visual acuity (BCVA in EDTRS letters) at start of treatment, 3 months, 6 months, 12 months as well as 3, 6, and 12 months after switch. Black line: group 1 (n=25 eyes in 25 patients); grey line: group 2 (n=25 eyes in 25 patients). Error bars represent the standard error of the mean (SEM).