
Figures & data
Table 1 Demographic Data of Patients with Baerveldt-350 mm2 and Ahmed 184 mm2 Implants
Figure 1 Graph demonstrating the mean intraocular pressures (IOPs) ± standard deviation after implantation of BGI and AGV devices in one-year follow-up. Error bars represent standard deviation.
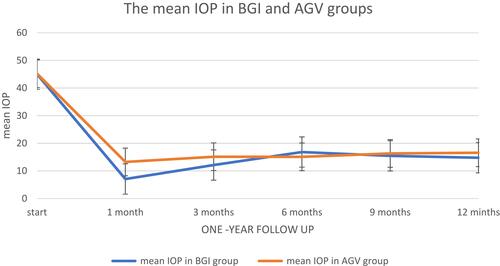
Table 2 Intraocular Pressure and Medical Therapy at Baseline and Follow-up in BGI and AGV groups
Figure 2 Graph demonstrating the mean number of glaucoma medications ± standard deviation after implantation of BGI or AGV in one-year follow-up. Error bars represent standard deviation.
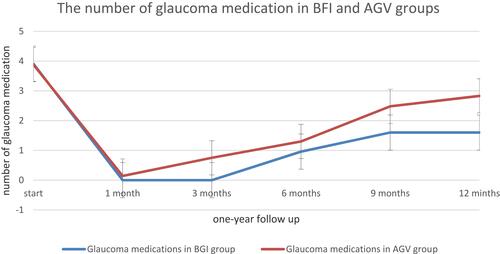
Figure 3 Kaplan-Meier survival curve of BGI and AGV groups reported 12% and 19.6% failure rate in one year follow up. The mean of BGI group was 403.80 (95% CI, 397.21–410.39), and the mean of AGV group was 389.21 (95% CI, 377.19–401.23). (0.364).
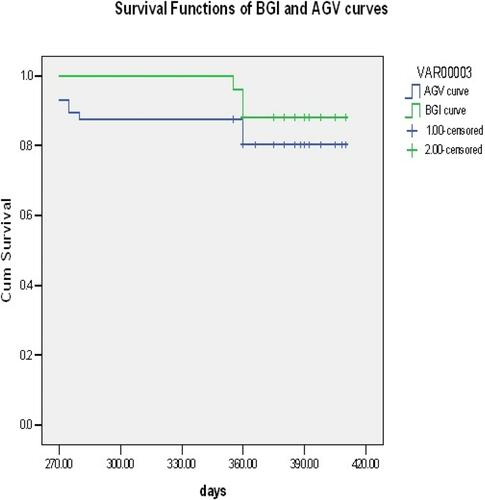
Figure 4 LogMAR chart shows the visual acuity changes before and after surgery in BGI group.
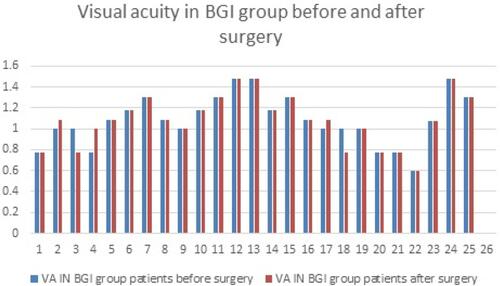
Figure 5 LogMAR chart shows the visual acuity changes before and after surgery in AGV group.
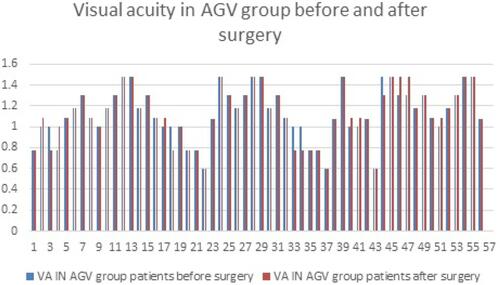
Table 3 Outcomes and Postoperative Complications after Implantation of the Baerveldt Glaucoma Valves or Ahmed Glaucoma Valves