
Figures & data
Table 1 Functional, Structural And Vascular Parameters In Patients With Unilateral PPG And Healthy Controls
Figure 1 RNFL, GCC thickness map and RPC VD in three eyes with unilateral preperimetric glaucoma. (A) Abnormal (red coded) thinning of superior temporal RNFL and superior GCC corresponded with a peripapillary area of decreased VD (41%). The inferior temporal sector showed dense VD (64%). (B) RNFL thickness map was borderline (yellow coded) inferotemporally. In GCC map a statistically abnormal (red coded) inferior focal thinning was detected which corresponded with a peripapillary area of decreased VD (38%). The superior temporal sector showed normal VD (52%). (C) A case of “green disease” in RNFL thickness map. Inferior temporal RNFL thickness was statistically within normal limits (green coded), though there was a difference of 13 μm between superior temporal (123 μm) and inferior temporal (110 μm) sectors. In GCC map a statistically significant red coded inferior focal thinning was detected which corresponded with a peripapillary area of decreased VD (43%). The superior temporal sector showed normal VD (55%).
Abbreviations: RNFL, retinal nerve fiber layer; GCC, ganglion cell complex; NDB, normative database; RPC, radial peripapillary capillaries; VD, vessel density.
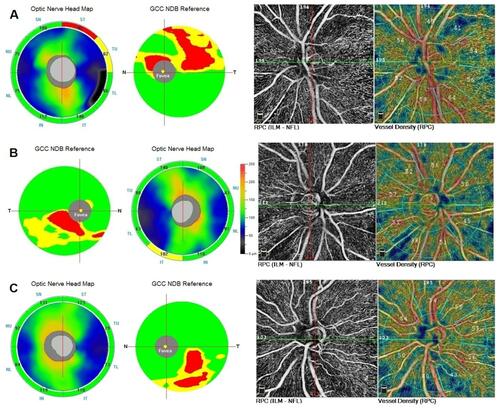
Table 2 Peripapillary Vessel Density (ppVD) Of Temporal Superior (TS) And Temporal Inferior (TI) Sectors In Patients With Unilateral PPG And Healthy Controls