Figures & data
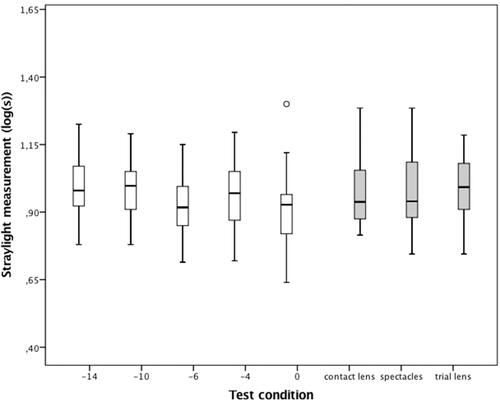
Figure 1 Calculated magnification factor as a function of refractive correction power in diopters (D) for thin contact lenses (dashed line), spectacles (solid line) and trial lenses (interrupted line).
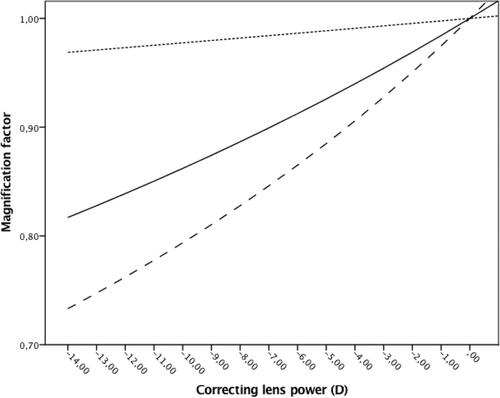
Table 1 Characteristics Of The Near-Emmetropic (A) And Myopic Study Group (B)
Table 2 Measured Straylight Values At Different Conditions Of Retinal Image Size For The Near-Emmetropic (A) And Myopic (B) Eyes
Table 3 Associations Of Mean Straylight Values And Possible Predictor Variables Generated By Linear Mixed Models In The Near-Emmetropic Study Group (A) And The Myopic Study Group (B)
Figure 2 Bland–Altman plots for the first and second straylight measurement differences with 95% limits of agreement (LoA) in the (A) near-emmetropic group and the (B) myopic group. Solid line: mean, dashed line: upper and lower LoA.
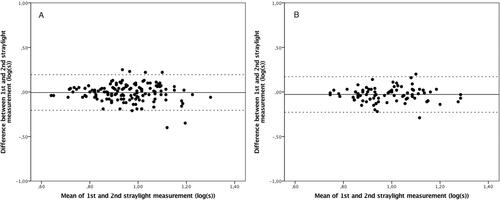
Figure 3 Boxplot of the straylight values measured by C-Quant in log-units (log(s)) for the 30 near-emmetropic eyes (white) and the 30 myopic eyes (gray) under the different test conditions.