Figures & data
Figure 1 Overall patient satisfaction. No differences were statistically significant (P<0.67 for very satisfied, Mann–Whitney U-test).
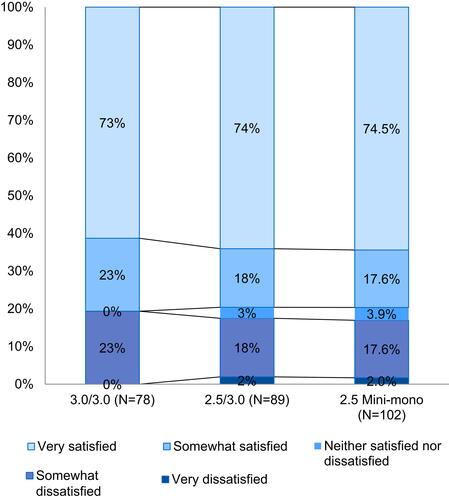
Figure 2 Overall spectacle independence (all activities). Patients with 2.5 mini-monovision were significantly more likely to need glasses “sometimes/never” instead of “frequently/always” compared with patients in the 2.5/3.0 and 3.0/3.0 groups (P<0.03, chi-square test).
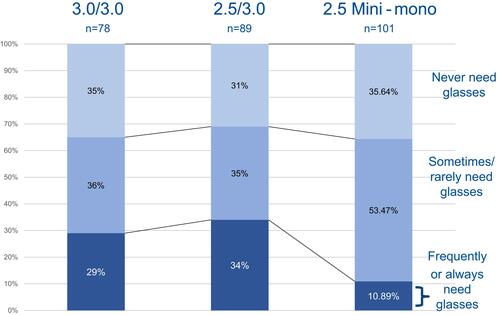
Figure 3 Spectacle independence by activity. Patients in the 2.5 mini-monovision group had significantly greater independence from glasses for computer use (P<0.0001, chi-square test) but a greater need for reading glasses, although this difference was not significant (chi-square test).
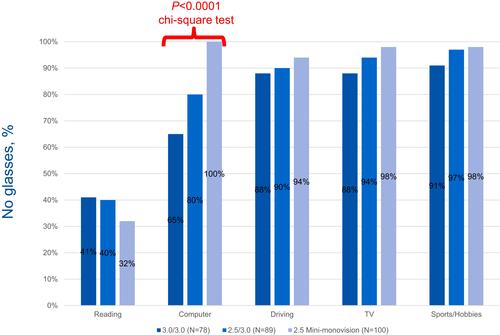
Figure 4 Glare and halos. Glare and halos were significantly less frequent and severe in patients in the 2.5/3.0 and 2.5 mini-monovision groups, compared with the 3.0/3.0 group (aP<0.0001, chi-square test).
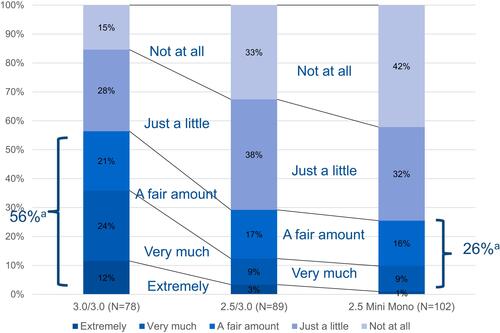
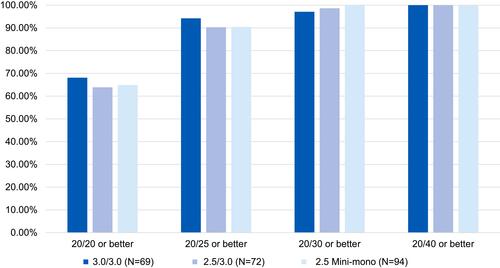
Figure 5 BCVA at 1 month. No differences were statistically significant (P>0.05, chi-square test).
Abbreviation: BCVA, best-corrected visual acuity.