Figures & data
Table 1 Demographic Characteristics Of Participants Shown As Means, Standard Deviations (SD) And Ranges
Figure 1 Cumulative proportion of eyes having a given uncorrected distance visual acuity (UDVA) and best-corrected distance visual acuity (CDVA) values for low-moderate and high groups, at 6 months postoperatively.
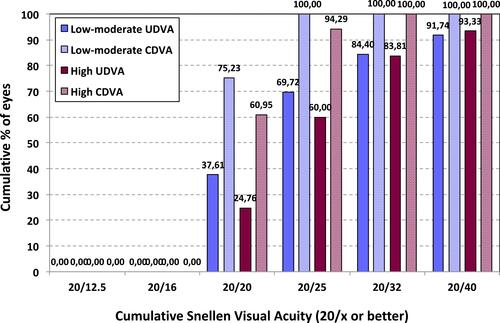
Figure 2 Difference between uncorrected distance visual acuity (UDVA) and best-corrected distance visual acuity (CDVA) values for low-moderate and high groups, at 6 months postoperatively.
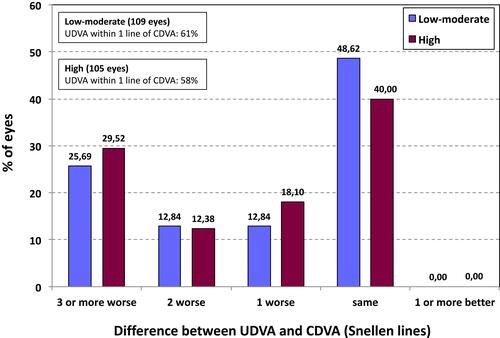
Figure 3 Postoperative spherical equivalent refraction (D) for low-moderate and high groups, at 6 months postoperatively.
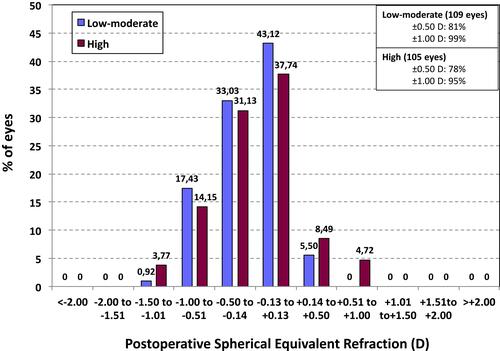
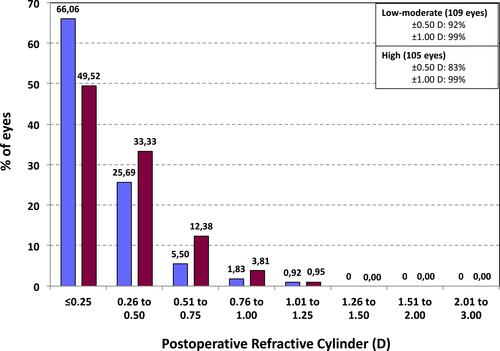
Figure 4 Postoperative refractive cylinder (D) for low-moderate and high groups, at 6 months postoperatively.