
Figures & data
Figure 1 (A) Longitudinal, 3 o’clock scan of a left eye with vitreous hemorrhage (VH). Gain is set at initial standard of 90 dB. (B) Same scan with maximum gain at 110 dB. The visualization of vitreous details improves with more gain. (C) Minimum image gain (MIG) obtained at 58 dB, where there is a completely “echo-silent” vitreous cavity.
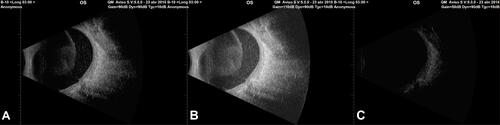
Table 1 Independent Samples t-Test for Group 1: VHs Vs Group 2: Controls
Table 2 Overall MIG Results, Segmented by Etiology of Vitreous Hemorrhage