Figures & data
Table 1 Best Corrected Visual Acuity (BCVA) Values (Mean Values and Standard Deviation) and Diopter Spherical Equivalent (SE) Values (Mean Values and Standard Deviation)
Table 2 Steady-State Pattern Electroretinogram (SS-PERG) Amplitude Values (Mean Values and Standard Deviation)
Table 3 Steady-State Pattern Electroretinogram (SS-PERG) Amplitude Values of the Right Eye (RE) and Left eye (LE) in Dyslexics and Control Subjects
Figure 1 Steady-state pattern electroretinogram waveforms recorded in the right and left eye of control normal subject (top) and dyslexic subject (bottom). It can be observed a reduction of waveform amplitude in both eyes of the dyslexic subject (bottom) against the normal subject (top). Moreover, the dyslexics have a waveform amplitude decrease in the LE compared to the RE while in the normal subjects we have a slight increase in waveform amplitude in the LE than in the RE.
Abbreviations: RE, right eye; LE, left eye.
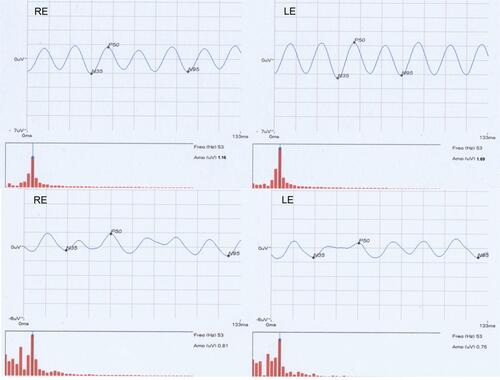
Table 4 Frequency Doubling Technology (FDT) Perimetry Values (Mean Values and Standard Deviation)
Table 5 Frequency Doubling Technology (FDT) Index Values of the Right Eye (RE) and Left eye (LE) in Dyslexics and Control Subjects
Table 6 Intragroup Steady-State Pattern Electroretinogram (SS-PERG) and Frequency Doubling Technology (FDT) Perimetry Index Values of the Right Eye (RE) and Left eye (LE) in Dyslexic Subjects and Control Subjects
Table 7 Spearman’s Correlation Test Between Steady-State Pattern Electroretinogram (SS-PERG) and Frequency Doubling Technology (FDT) Index Values in the Right Eye (RE) and in the Left Eye (LE) of Dyslexic Subjects and of Control Subjects
Figure 2 Scatterplot of Spearman’s correlation test between steady-state pattern electroretinogram (SS-PERG) and frequency doubling technology (FDT) in the dyslexic group.
Abbreviation: PSD, pattern standard deviation.
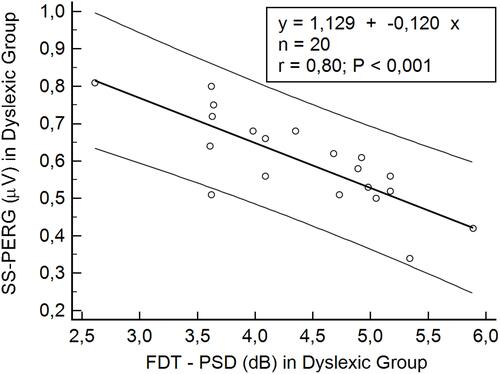
Figure 3 Scatterplot of Spearman’s correlation test between steady-state pattern electroretinogram (SS-PERG) and frequency doubling technology (FDT) in the left eye of the dyslexic group.
Abbreviation: PSD, pattern standard deviation.
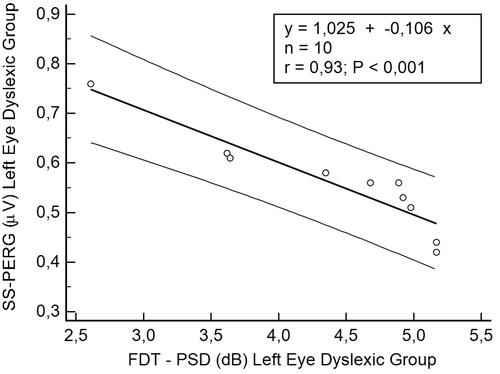
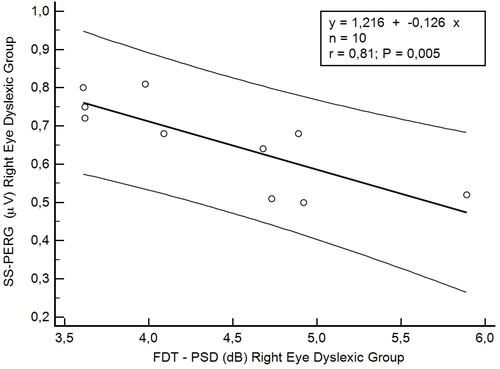
Figure 4 Scatterplot of Spearman’s correlation test between steady-state pattern electroretinogram (SS-PERG) and frequency doubling technology (FDT) in the right eye of dyslexic group.
Abbreviation: PSD, pattern standard deviation.