Figures & data
Table 1 Visual acuity and contrast visual acuity of the three groups
Figure 1 Measurement of contrast visual acuity. (A) Data obtained with 100% and 10% contrast under photopic conditions. (B) Data obtained with 100% and 10% contrast under mesopic conditions. ◆ control, ■ RP-1 group, and ▴ RP-2 group.
Notes: Data are the mean ± standard deviation of three measurements. *P < 0.05 and **P < 0.001.
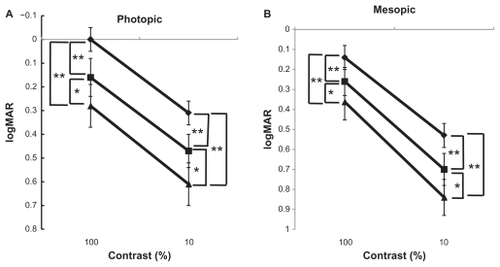
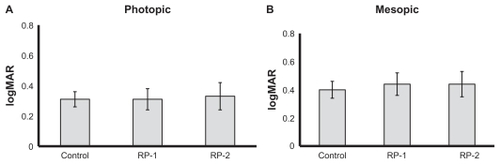
Figure 2 Differences between visual acuity and contrast visual acuity with 100% contrast under photopic (A) and mesopic conditions (B).
Notes: Data represent the mean ± standard deviation for three measurements. *P < 0.05 and **P < 0.001.
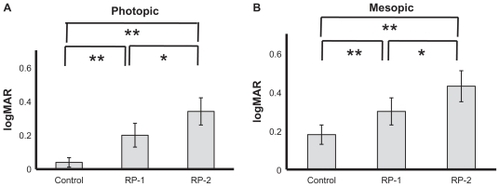
Figure 3 Differences in contrast visual acuity for 100% and 10% contrast under photopic (A) and mesopic (B) conditions.
Note: Data are the mean ± standard deviation of three measurements.