Figures & data
Table 1 The Ophthalmic Data
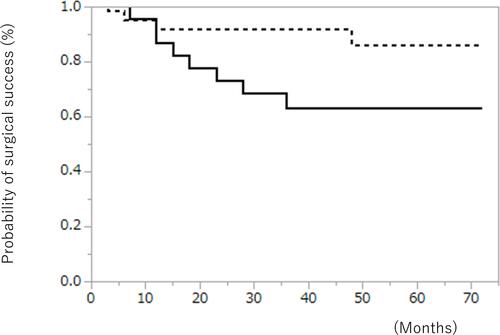
Figure 1 Results of the Kaplan–Meier analysis that used Criteria A and Criteria B. Solid line: Criteria A. Dotted line: Criteria B.
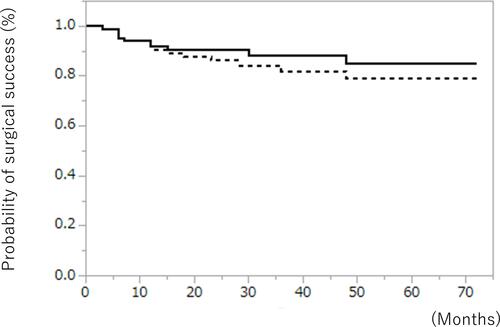
Table 2 Results of A Multivariate Analysis of Factors Associated with Surgical Outcomes with Criteria A
Table 3 Results of a Multivariate Analysis of Factors Associated with Surgical Outcomes with Criteria B
Table 4 The Post-Operative IOP Value and Number of Glaucoma Medications
Table 5 The Mean Post-Operative ECD Value in the AC Group
Table 6 The Mean of Post-Operative ECD Value in the VC Group
Table 7 Comparison of the Mean of Post-Operative ECD Reduction Rates in the AC and VC Groups
Figure 2 Comparison of surgical outcomes between the AC group and VC group with Criteria A. Solid line: AC group. Dotted line: VC group. No significant difference (p=0.516).
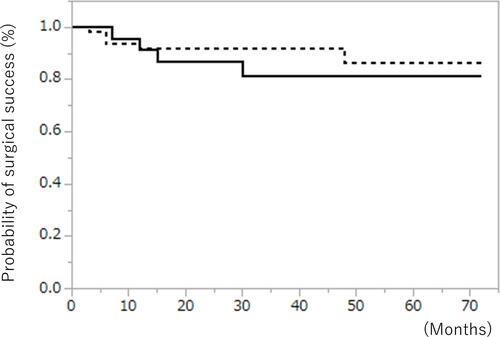
Figure 3 Comparison of surgical outcomes between the AC group and VC group with Criteria B. Significantly better surgical outcomes were achieved in the VC group vs the AC group (p=0.0241, log-rank test). Solid line: AC group. Dotted line: VC group.