Figures & data
Figure 1 Fundus photograph, fluorescein angiographic image, Humphrey static perimetry, and Optical coherence tomography (OCT) of the right eye. (a) Fundus photograph at the onset showing that the retina was normal. (b) Fluorescein angiography at the onset showing normal vascular pattern and no leakage. (c) Humphrey static perimetry at the onset showing enlarged blind spot (30-2 strategy MD −21.97 dB). (d) Humphrey static perimetry 3 months after the onset showing marginally enlarged blind spot (30-2 strategy MD −1.90 dB). (e) OCT image at the onset showing irregular inner segment/outer segment (IS/OS) line over the nasal fovea. (f) OCT image 5 months after the onset showing reappearance of IS/OS line over the nasal fovea.
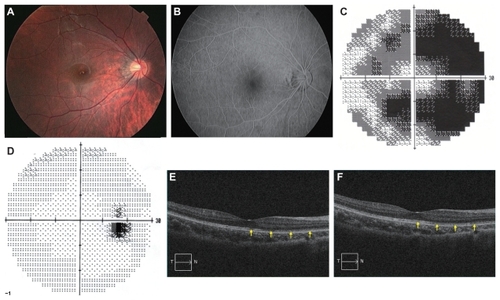
Figure 2 Pattern visual evoked potentials (VEPs). At the onset, pattern VEPs are severely reduced in the right eye. One month after the onset, the P100 component of the pattern VEPs has a prolonged latency of 130 milliseconds. Six months after the onset, the P100 recovers to 110 milliseconds.
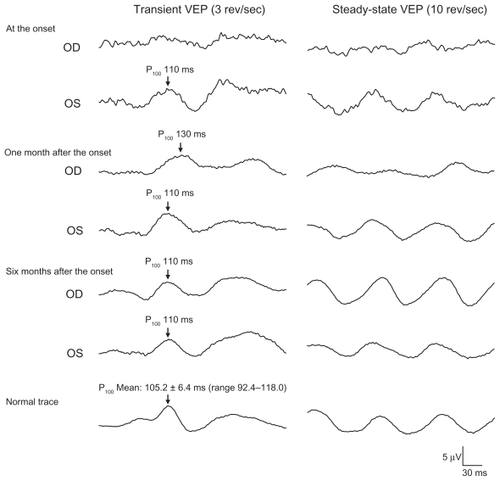
Figure 3 Full-field electroretinographics (ERGs). At the onset, the amplitudes of the rod and cone responses in the right eye are reduced to about 50% of those in the left eye. At the 1 year follow-up examination, the reduced full-field ERGs are improved to be approximately the same amplitudes as those from the left eye.
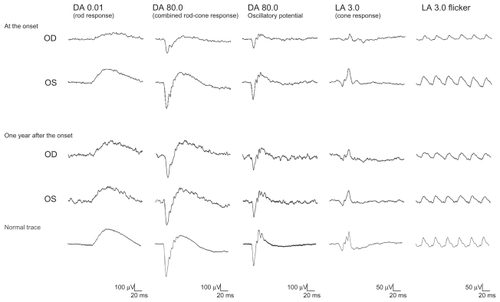
Figure 4 Multifocal electroretinographics (ERGs). At the onset, the multifocal ERGs are reduced in the right eye. At the 1 year follow-up examination, the multifocal ERGs have improved but are still reduced especially from the temporal retina. Shorter duration protocol with 61 hexagonal elements was used for the latest recording, because acceptable responses to 103 hexagonal elements could not be obtained due to fatigue of the patient during the recording.