
Figures & data
Table 1 Demographic Characteristics of Patients by Injected Medication
Table 2 Injection Patterns by Lens and Event Status
Figure 1 Histogram showing time from first intravitreal anti-vascular endothelial growth factor injection to development of glaucoma or sustained ocular hypertension, with each column representing 2 months. Incidence is distributed over 4+ years of follow-up, with 8 subjects developing disease before 1 year, 22 from years 1–3, and an additional 10 after 3 years from the first injection.
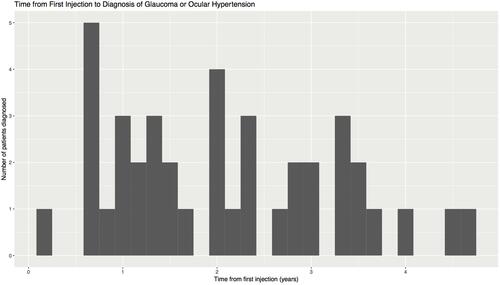
Table 3 Logistic Regression Results Predicting the Probability of Glaucoma or Sustained Ocular Hypertension
Figure 2 Using the results of the logistic regression (coefficients from the reduced model in ), the predicted probability of disease is graphed against the highest injection rate over any 6-month period. This relationship is displayed distinctly for the four combinations of sex and lens status.
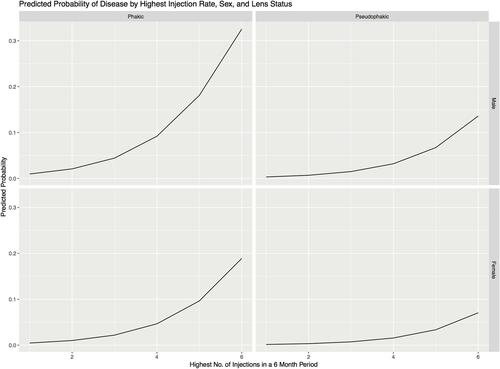
Table 4 Odds Ratios for Firth’s Logistic Regression (See )