Figures & data
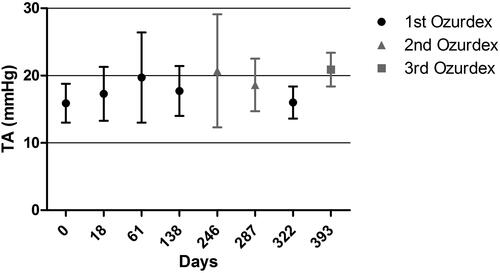
Figure 1 Visual acuity (VA) of all patients.
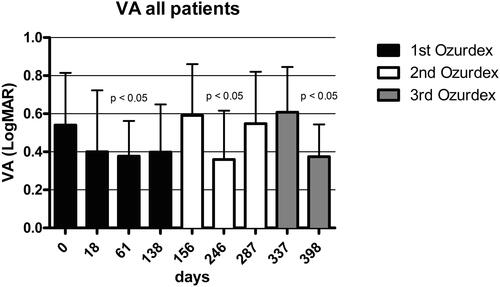
Table 1 Demographic Data (Standard Deviation)
Figure 2 Visual acuity (VA) of the patients that managed with one dexamethasone implant.
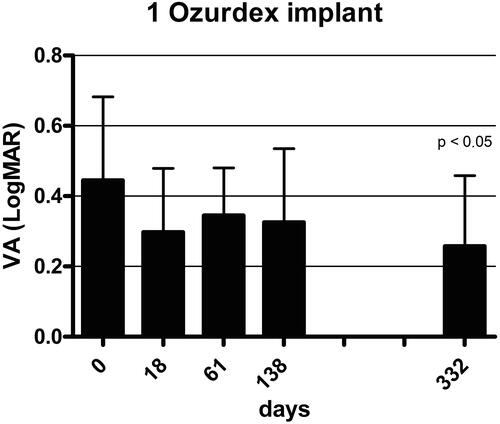
Figure 3 Visual acuity (VA) of the patients that needed two or three dexamethasone implants. The second implant was injected at day 156 and third implant at day 337.
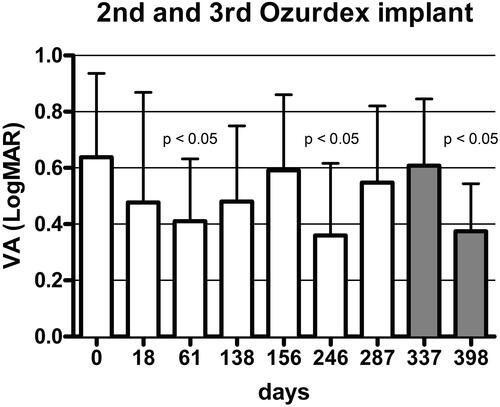
Figure 4 Central retinal thickness (CRT) of the patients that managed with one dexamethasone implant.
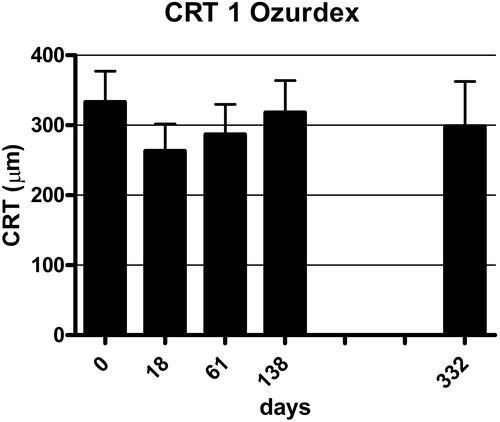
Figure 5 Central retinal thickness (CRT) of the patients that needed two or three dexamethasone implants.
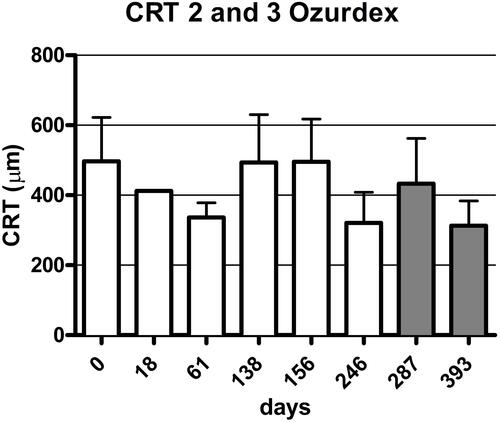
Table 2 Accumulation of Hyper-Reflective Spots (HRS) (Standard Deviation)
Figure 6 Hyper-reflective spots (HRS) in the inner nuclear layer (INL) and in the outer plexiform layer (OPL) are seen more prominently in the OCT before the dexamethasone implant. Magnification of Group 1 (A and B) and Group 2 (C and D) OCT pictures.
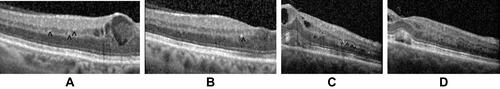
Figure 7 The OCT before and after dexamethasone implant. Group 1 (parafoveal cysts) before (A) and after (B) the dexamethasone implant. Group 2 before (C) and after (D) the dexamethasone implant.
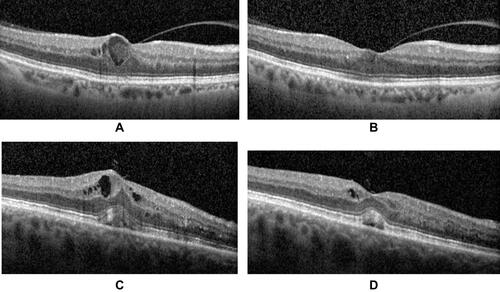
Figure 8 Intraocular pressure (IOP).