Figures & data
Table 1 Summary of S-CXL Preoperative and Postoperative Visual, Topographic and Refractive Data Analysis
Figure 1 The standard graphs of the visual and refractive outcomes: (A) the cumulative logMAR visual acuity; (B) the change in CDVA; (C) the attempted versus achieved postoperative SE refraction in a scatterplot; (D) the refractive accuracy of SE; (E) the refractive cylinder; (F) the refractive stability of SE; (G) the refractive stability of cylindrical component and (H) the refractive stability of spherical component.
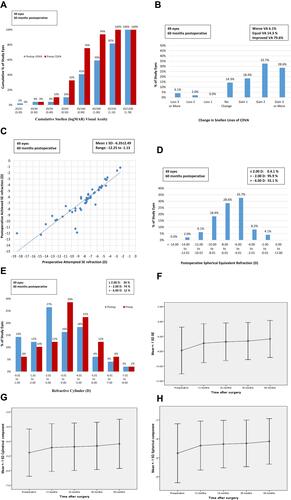
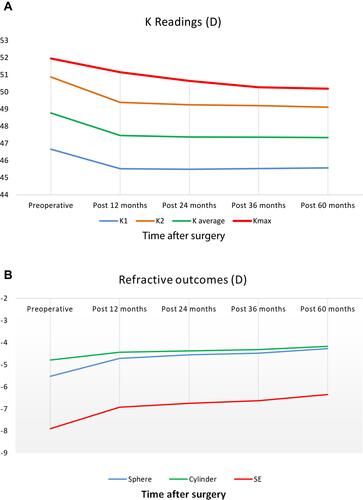
Figure 2 The relationship graphs of topographic and refractive outcomes: (A) K readings relationships; (B) spherical, cylindrical and SE components relationships.