
Figures & data
Figure 1 OCT showing hyper-reflective deposits in the intra-retinal layer (circle), PED (Triangle), and neurosensory retinal detachment.
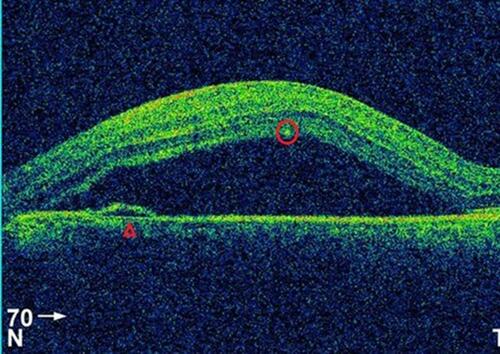
Figure 2 The disrupted IS/OS junction is demonstrated by a thin arrow.
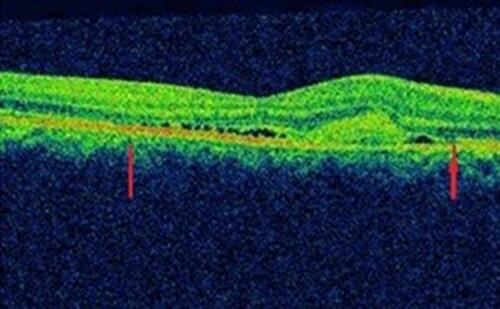
Figure 3 Locally thickened neurosensory retina (“retinal dipping”, star), connected by a hyper-reflective flow, suggesting high fibrin/protein content (arrow).
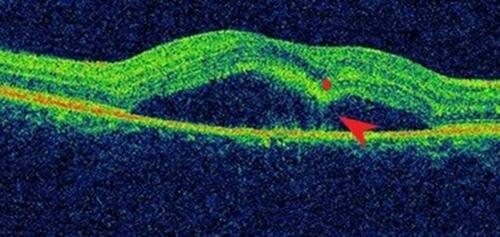
Table 1 Comparision of OCT Features in Resolved and Non-Resolved CSCR
Table 2 OCT Findings in Relation with Visual Outcome