
Figures & data
Figure 1 CONSORT diagram of study process.
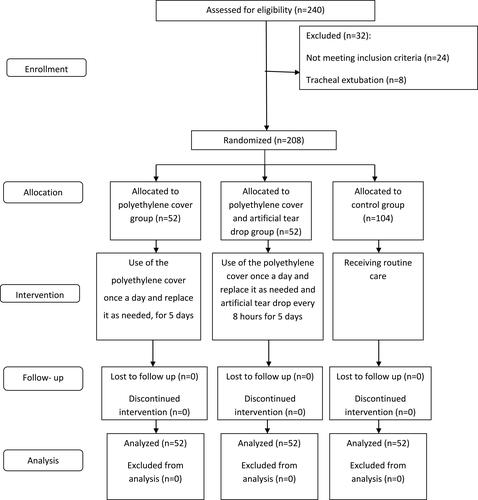
Table 1 Demographic Characteristics Of Participants In Each Of The Study Groups
Table 2 Comparison Of The Level Of Eye Dryness In The Intervention And Control Eyes In Each Group From The First To Fifth Day Of The Study
Table 3 Comparison Of Eye Dryness Between The Two Groups From The First To Fifth Day Of The Study