Figures & data
Table 1 Demographics, Pre- and Postoperative Refraction and Visual Acuity
Table 2 Mean Values and Standard Deviation of Different DED Tests (Test Eye)
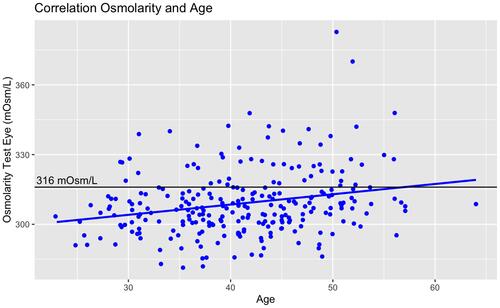
Table 3 Prevalence of DED as Determined by Signs and Symptoms
Figure 1 Comparing the prevalence of DED as determined by different tests between LVC or ICL and control group.
Notes: *Pearson's χ2: difference from control group.
Abbreviations: BUT, Break-up time; OSDI, ocular surface disease index; AVG, average; ICL, Implantable collamer lens; LVC, laser vision correction.
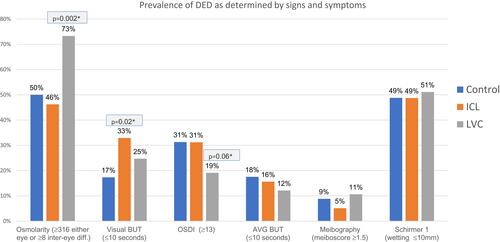
Figure 2 Example of weak correlations, here between osmolarity and age. Several outliers are influencing the fit. The single eye osmolarity cut-off value of 316 mOsm/L is shown for reference.