Figures & data
Figure 1 Initial presentation. Best corrected visual acuity 20/80. (A) Color fundus photograph demonstrates extensive, confluent inferior retinal hemorrhages with macular involvement. (B) Optical coherence tomography demonstrates intraretinal cysts and subretinal fluid. Central foveal thickness 696 microns (central 1 mm subfield). (C–E) Fluorescein angiography. (C) Early: 28 seconds, (D) 2.37 minutes, and (E) Late: 9.42 minutes, extensive blockage from hemorrhage and late hyperfluorescence.
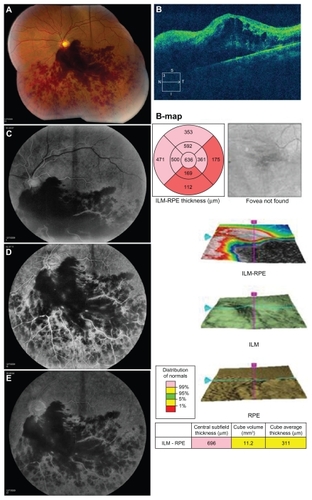
Figure 2 Cirrus spectral domain optical coherence tomography progression. (A) Best corrected visual acuity 20/60, improved intraretinal and subretinal fluid (central foveal thickness 534 microns) after initial intravitreal bevacizumab injection four weeks earlier. (B) Best corrected visual acuity 20/70, central foveal thickness 682 microns. (C) Color fundus photograph six weeks after third intravitreal bevacizumab injection. Improved confluent macular hemorrhage. (D) Best corrected visual acuity 20/40, central foveal thickness 473 microns, corresponding optical coherence tomography to (C) visit.
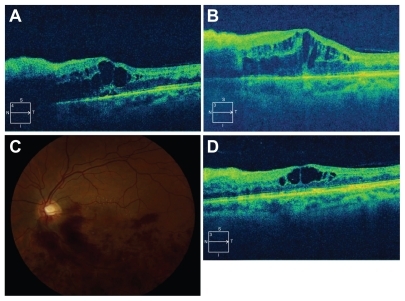
Figure 3 Recent follow-up. Best corrected visual acuity 20/25. (A) Color fundus photograph demonstrates resolution of majority of confluent hemorrhages. (B) Optical coherence tomography demonstrates resolved fluid (central foveal thickness 261 microns) and presence of subfoveal inner and outer segment disruption.
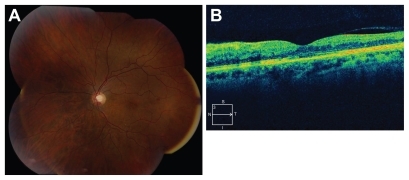
Table 1 Branch retinal vein occlusion summary dataCitation5,Citation9,Citation10
Table 2 Central retinal vein occlusion summary dataCitation6,Citation9,Citation10