Figures & data
Figure 1 Binocular uncorrected distance visual acuity (UDVA) and manifest refraction spherical equivalent (MRSE) for dominant and non-dominant eyes. The blue and red curved lines indicate polynomial regression curves for dominant and non-dominant eyes, respectively.
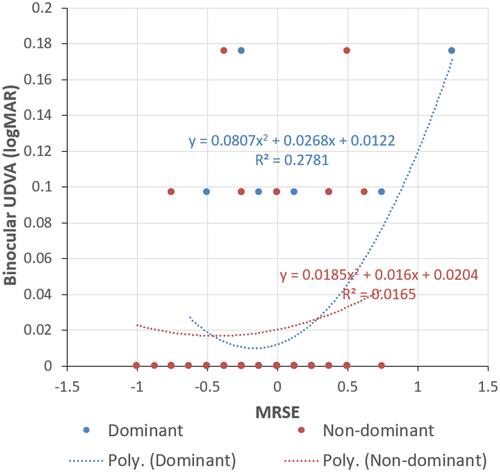
Figure 2 Binocular uncorrected intermediate visual acuity (UIVA) and manifest refraction spherical equivalent (MRSE) for dominant and non-dominant eyes. The blue and red curved lines indicate polynomial regression curves for dominant and non-dominant eyes, respectively.
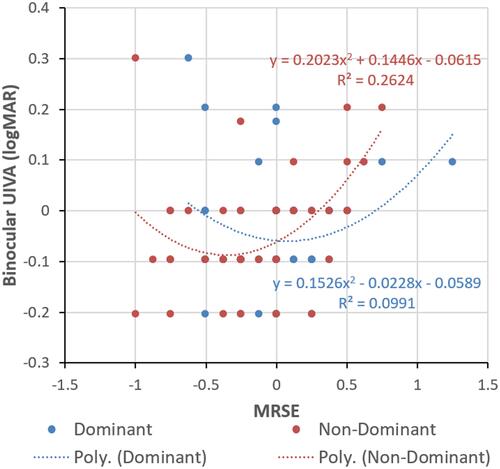
Figure 3 Binocular uncorrected near visual acuity (UNVA) and manifest refraction spherical equivalent (MRSE) for dominant and non-dominant eyes. The blue and red curved lines indicate polynomial regression curves for dominant and non-dominant eyes, respectively.
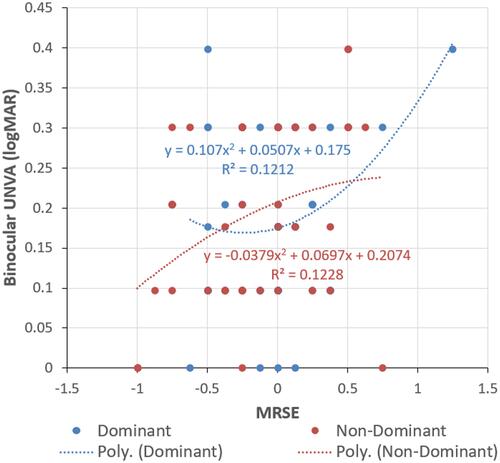
Figure 4 Combined binocular uncorrected visual acuity at distance, intermediate and near and manifest refraction spherical equivalent (MRSE) for dominant and non-dominant eyes. The blue and red lines indicate polynomial regression curves for dominant and non-dominant eyes, respectively.
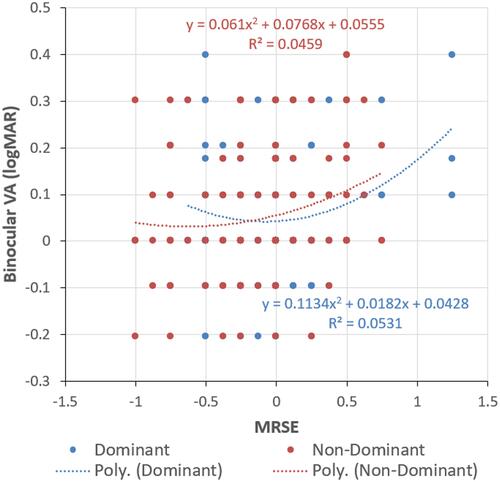
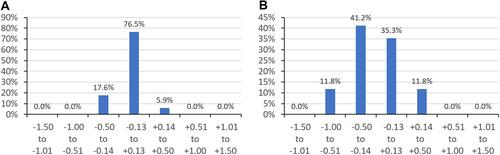
Figure 5 Non-cumulative manifest refraction spherical equivalent (MRSE) frequency distribution for 17 patients with uncorrected distance visual acuity (UDVA), uncorrected intermediate visual acuity (UIVA) of 20/20 or better, and uncorrected near visual acuity (UNVA) of 20/30 or better for dominant (A) and non-dominant eyes (B).