Figures & data
Figure 1 The design of the trifocal supplementary add-on IOL is optimized for implantation into the ciliary sulcus.
Notes: Four flexible haptics position the lens in the ciliary sulcus; Six diffractive rings, and +1.75 D and +3.0 D additions ensure trifocal performance.
Abbreviation: IOL, intraocular lens.
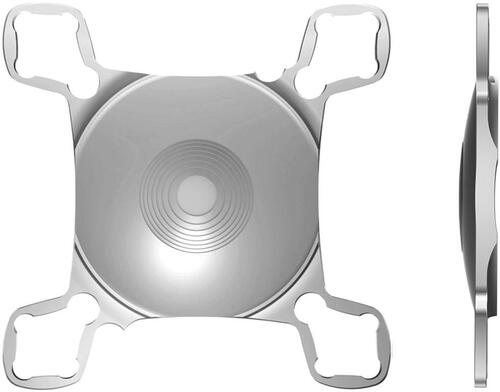
Figure 2 Distribution of the spherical power of the implanted IOLs (n=18).
Notes: The appropriate refractive power of the supplementary IOLs was calculated using the free online calculator provided by the manufacturer.
Abbreviation: IOL, intraocular lens.
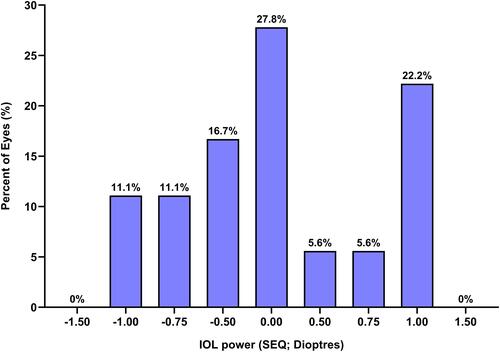
Table 1 Preoperative Demographics of the Patients
Figure 3 Position of the primary and the trifocal supplementary IOL (B) in the eye.
Notes: (A, B) An interlenticular space of approximately 874–935 µM minimizes the risk of interlenticular opacification. (C, D) Cornea angle is wide enough (21.69°) to maintain physiological function of the anterior segment and to prevent secondary glaucoma. All photographs were taken 6 months postoperatively.
Abbreviation: IOL, intraocular lens.
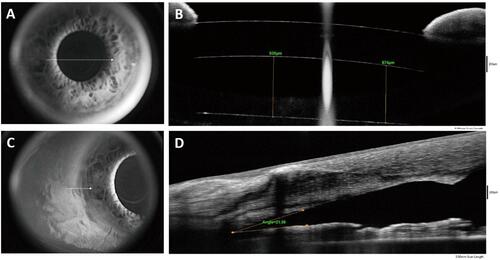
Figure 4 Endothelial cell number before and after the implantation of the secondary IOL.
Notes: Endothelial cell loss during surgery is minimal (2.00 ±1.58%; range: 0.23– 5.14%).
Abbreviation: IOL, intraocular lens.
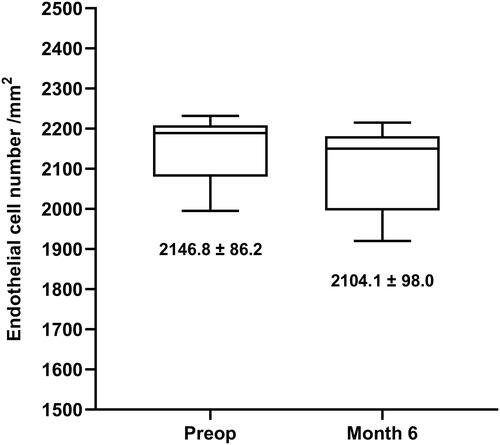
Figure 5 Spherical refractive errors measured with autorefractometer and subjectively for distance and near prior to and 6 months after the implantation of the secondary lens.
Notes: Boxplots represent mean ± SD, and minimum and maximum values of n= 18 eyes (11 patients). Matching pre- and postoperative variables were compared with the two-tailed paired t-test or its non-parametric equivalent. ****p<0.0001.
Abbreviations: SPH, spherical refraction; SD, standard deviation.
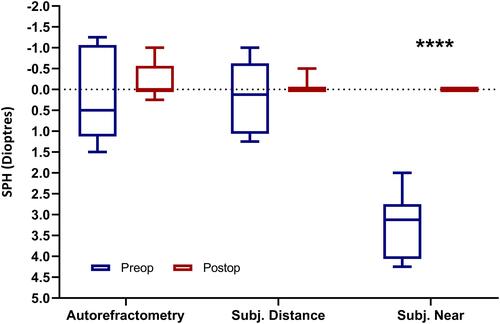
Figure 6 Spherical refractive errors were corrected efficiently compared to the preoperative status.
Notes: (A) Distribution of preoperative spherical refractions. (B) Distribution of postoperative spherical refractions. Bars represent the percent of eyes; n= 18 eyes (11 patients).
Abbreviations: SPH, spherical refraction; Postop, postoperative.
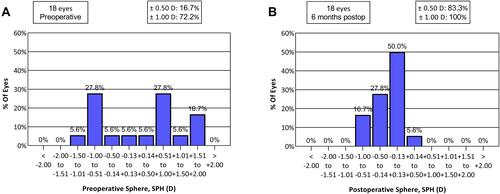
Table 2 Visual Acuities and Required Visual Correction Before and After Supplementary IOL Implantation
Figure 7 Visual acuities improved significantly compared to the preoperative status at all distances.
Notes: Bars represent mean ± SD; n= 18 eyes (11 patients). Matching pre- and postoperative variables were compared with the two-tailed paired t-test or its non-parametric equivalent. ****p<0.0001.
Abbreviations: logMAR, Tenth-based logarithm of the Minimal Angle Resolution; SD, standard deviation.
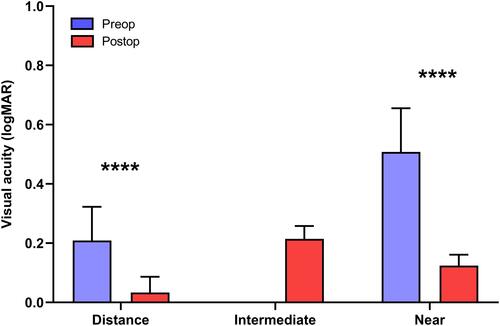
Figure 8 Defocus curve of the add-on IOL shows superior visual acuity in intermediate and near ranges compared to the trifocal capsular bag intraocular lens. Depth of focus is identical in eyes implanted with each of these lenses.
Notes: (A) Monocular defocus curve (n= 12 eyes) with the supplementary IOL compared to the binocular defocus curve (n=20 eyes) of a trifocal capsular bag intraocular lens. (B) Comparison of the DOF curves obtained with the add-on IOL, and the capsular bag intraocular lens. *p<0.05; **p<0.01; ***p<0.001.
Abbreviations: logMAR, Tenth-based logarithm of the Minimal Angle Resolution; IOL, intraocular lens; DOF, depth of focus; n, number of cases; p, probability value.
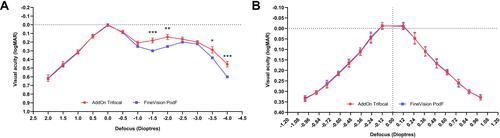
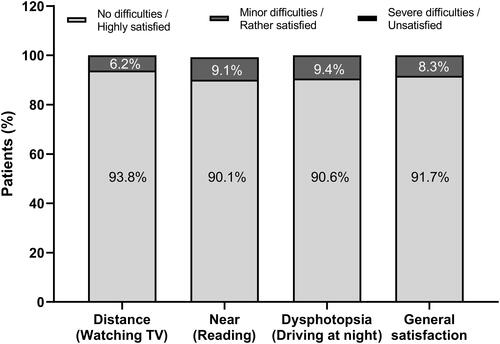
Figure 9 Patient satisfaction 6 months after the implantation of the supplementary add-on IOL.
Notes: High satisfaction was reported in all examined vision-related issues. Results are calculated from the answers of all 11 patients.