
Figures & data
Table 1 Discontinuation of Care
Table 2 Treatment Exposure Over 3 Years with Subgroup Analyses
Table 3 Number of Patients Received Injections with Varied Combination Modes in Each Year
Figure 1 Number of intravitreal injections received by the whole cohort and by different RVO subgroups in each year.
(A) Percentage of patients (of the whole cohort) received X number of injections each year. (B) Year 1 RVO subgroup analyses: all subgroups shared similar frequency distribution, one CRVO patient (of neovascular glaucoma) needed 11 injections in Year 1. (C) Year 2 RVO subgroup analyses: BRVO and HRVO had the most numbers of patients not needing re-injections this year; and CRVO patients accounted for higher injection frequency. (D) Year 3 RVO subgroup analyses: 55% of BRVO needed no injections in Year 3, one HRVO patient had a severe recurrence and needed 10 injections.
Abbreviations: RVO, retinal vein occlusion; CRVO, central retinal vein occlusion; HRVO, hemi-retinal vein occlusion; BRVO, branch retinal vein occlusion.
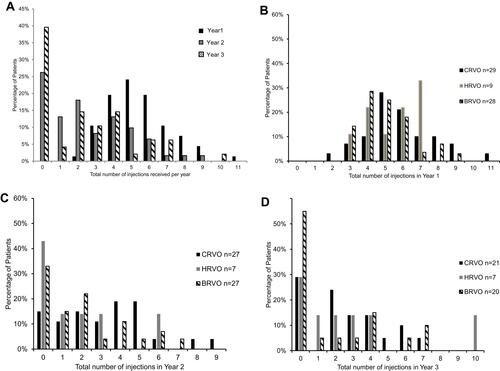
Figure 2 Trend of combined modalities received by the whole cohort of each year. All patients received injections in Year 1: 30% required only the initial loading dose of three Ranibizumab for disease stability and 69.7% needed combination therapy for disease stability. In Year 2, 41% received Ranibizumab alone, 6.6% needed just Ozurdex for the whole Year 2. Combination therapy was less frequent in subsequent years; 25% and 40% of patients received no injections in Year 2 and Year 3 respectively.
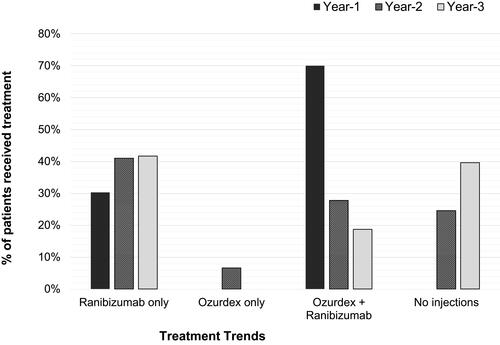
Table 4 Comparison of VA and CRT Against Baselines
Figure 3 Trend in median visual acuity (VA) and median central retinal thickness (CRT) for each cohort year. Both VA and CRT improved and stabilised after a loading phase of Ranibizumab. In particular, VA stabilisation at LogMAR 0.48 (Snellen 6/18) level in each year was similar as VA first achieved after the loading phase. Hence, it is possible that “vision achieved 4-weeks post-loading phase” could potentially be useful as a prognostic VA predictor in longer term.
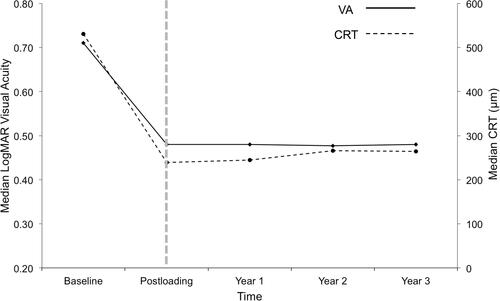
Table 5 Adverse Effects and Other Ocular Procedures