Figures & data
Table 1 Summary of the Main Characteristics in 19 Patients with Ocular Manifestations from Giant Cell Arteritis
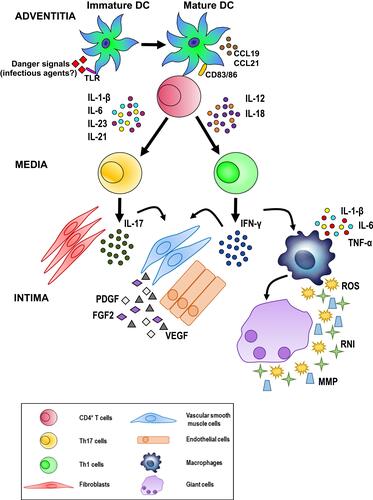
Figure 1 Frequency of clinical features and abnormalities of laboratory data, temporal artery biopsy findings and color Doppler ultrasound imaging in our cohort of GCA patients.
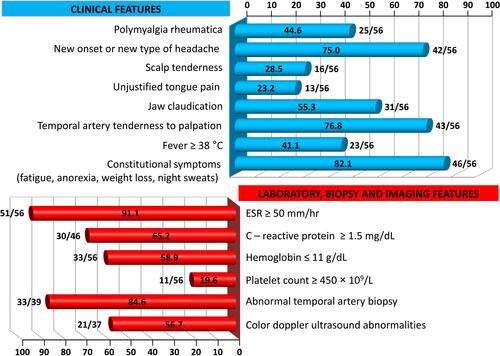
Figure 2 Giant cell arteritis with subatrophy of the right eyeball as a consequence of the ophthalmic artery occlusion (panels A and B). In addition to constitutional symptoms, the patient complained of persistent headaches and scalp tenderness. Three weeks later, one large and one smaller eschars appeared on the scalp that eventually resulted in cicatricial areas of alopecia (panels C and D).
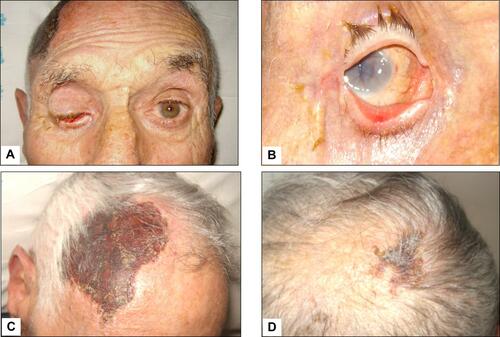
Figure 3 (A) Color Doppler ultrasonography (CDUS): longitudinal scan reveals a hypoechoic plaque in the proximal internal carotid artery. (B) CDUS of the right temporal artery shows a hypoechoic halo around the lumen in transverse view (arrow). (C) CDUS of the right temporal artery shows a hypoechoic halo around the lumen in transverse view (arrow). The halo sign corresponds to edema of the artery wall. (D) Longitudinal view of the right temporal artery by CDUS shows a hypoechoic halo of the temporal artery and the presence of turbulent and weak flow, suggesting the presence of stenosis. The peak systolic velocity is 1 m/s, that is double compared to the segment without stenosis.
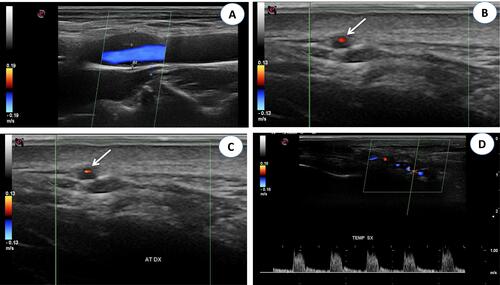
Figure 4 Giant cell arteritis of the left temporal artery. Panel A shows a prominent, tender and beaded artery, that was also hypo-pulsating on palpation. Panels B to F illustrate the various phases of the temporal artery biopsy. A 2 cm-long segment of the frontal branch of the superficial temporal artery was surgically removed.
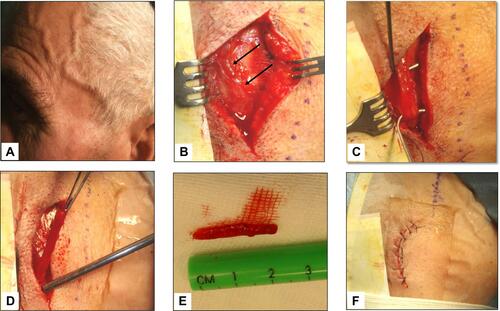
Figure 5 (A) Histological findings in the wall of a giant cell arteritis. Wall thickening is mainly due to myofibroblastic proliferation of the intima, with a minimal exudate consisting of lymphocytes and plasma cells. The media is distorted by the granulomatous process, which extends into the adventitia. In the latter, a minimal fibrosis is present. (B) The media of the artery shows a layer of giant cells on its inner aspect, the site of the inner elastic membrane, and small fragments of elastic fibers in the cytoplasm of giant cells (arrows). Numerous other inflammatory cells are seen in the intima wall. The muscular fibers are degenerate, as evidenced by the cytoplasmic vacuoles.
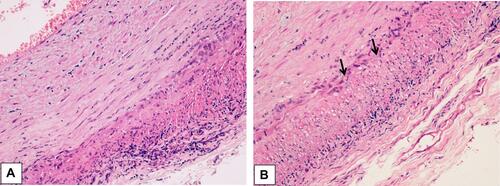
Figure 6 Distribution of ocular manifestations in 19 GCA patients of our cohort. The numbers between brackets indicate the relative percentages.
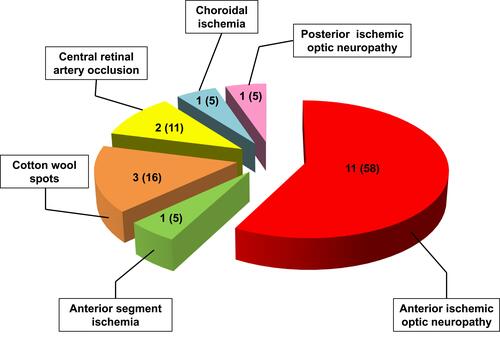
Figure 7 Scanning laser ophthalmoscopy and fluorangiography patterns in a GCA patient with acute ischemia of the papilla. Pale colored edema and light swelling are evident on the optic disc (panels A and B). Four months later the pattern changed to optic nerve atrophy (panel C).
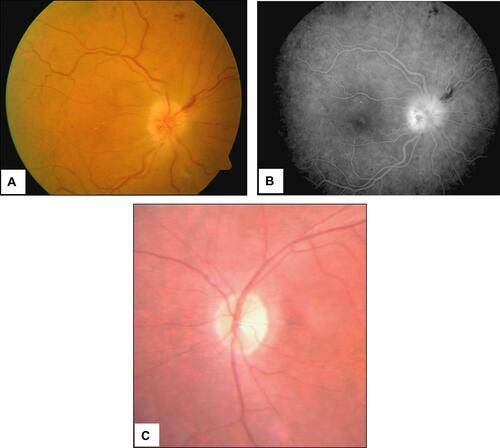
Figure 8 Possible pathogenetic algorithm of giant cell arteritis (GCA). After activation by danger signals, dendritic cells resident in the arterial adventitia mature, produce chemokines such as CCL19 and CCL21, and express the co-stimulatory molecules CD83 and CD86 required for their interaction with CD4+ T cells. Dendritic cells also release cytokines, such as IL-1 β, IL-6, IL-23 and IL-21 or IL-12 and IL-18 that trigger two distinct networks. The first network induces the differentiation of activated T cells into Th17 cells; the second drives Th1 cell formation. Both T cell lineages participate in the evolving granulomatous inflammation. See text for details.