Figures & data
Figure 1 Distribution of patients’ responses of significant discomfort (score ≥ 4) for each step of the intravitreal injection procedure.
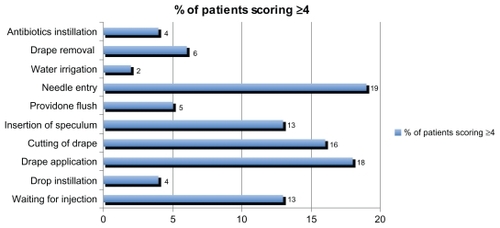
Figure 2 Distribution of patients’ responses of significant discomfort (score ≥ 4) with the “draping process,” grouped as a whole. The draping process accounts for 53% of the total number of significant discomfort responses.
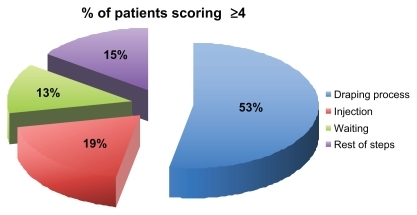
Table 1 Mean and range of scores for each step of the intravitreal injection procedure