Figures & data
Figure 1 Treatment planning page for the WaveLight Contoura® Vision laser.
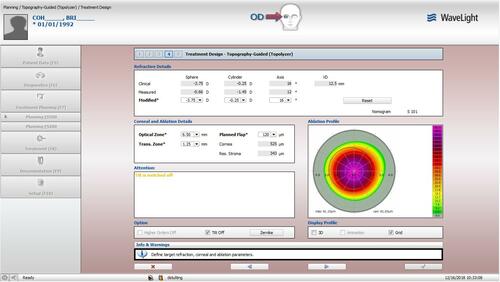
Table 1 Treatment Method Actually Used at Each Site
Table 2 Refractive Data Summary
Table 3 Difference in Refractive and Topographic Astigmatism Angle and Magnitude
Figure 2 Cumulative uncorrected visual acuities at 3 months.
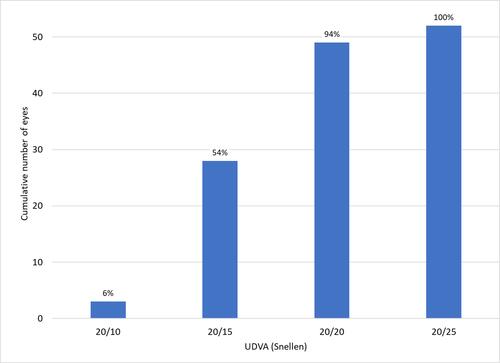
Figure 3 Change in corrected distance visual acuity from preoperative exam to the 3-month postoperative exam.
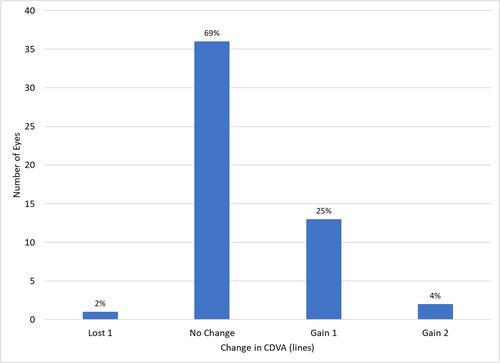
Table 4 Centroids and Error Magnitude for Expected or Actual Cylinder Error by Method
Table 5 Magnitude of Actual and Calculated Error Vectors by Method
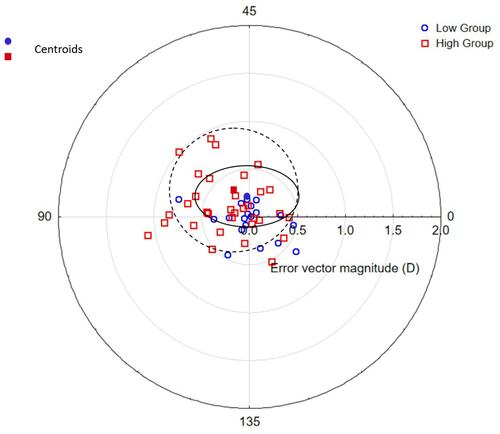
Figure 4 Error vectors: difference between calculated Manifest and Best outcomes. Ellipses are the centroid ± SD for the low (
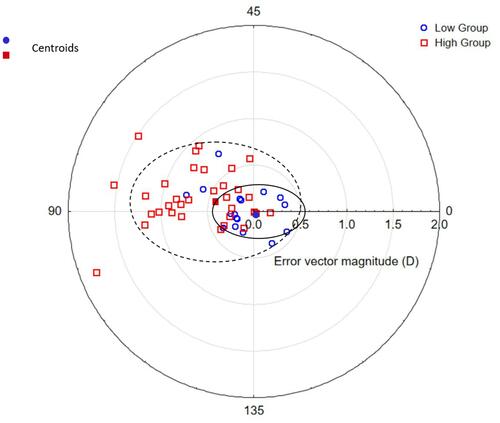
Figure 5 Error vectors: difference between Topo and Best outcomes. Ellipses are the centroid ± SD for the low (
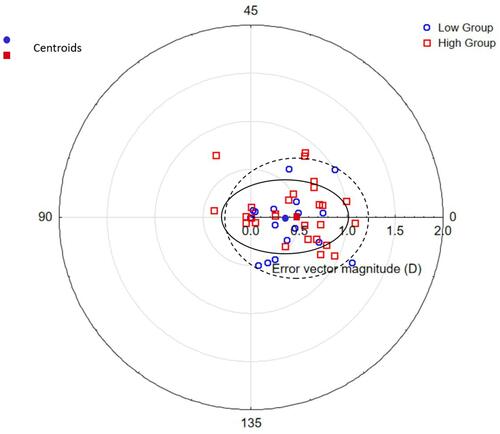
Figure 6 Error vectors: difference between Phorcides and Best outcomes. Ellipses are the centroid ± SD for the low (