Figures & data
Table 1 Patient TC Donors That Created the HTCF Cell Lines Used for Experimentation
Figure 1 Using qPCR to quantify pro-fibrotic and anti-fibrotic gene expression variation between HTCFs derived from patients medically treated for glaucoma (glaucomatous; G) and patients not treated for glaucoma (non-glaucomatous; NG). The relative mRNA expression of ACTA2, ITGβ-5, VEGFA, COL3A1 and GREM1 (A–E) were significantly increased for glaucomatous patients. The values were expressed as a mean ±SE from three independent experiments (*P<0.05). There is no significant difference in CCN2, COL1A2 and CCN3 mRNA expression (F–H) between HTCFs derived from glaucomatous and non-glaucomatous patients.
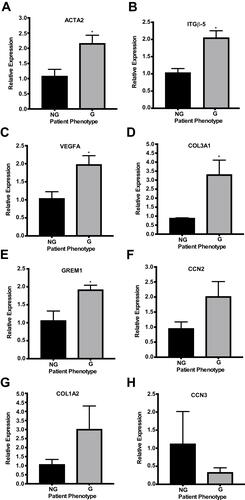
Figure 2 Comparing the ratio of the amount of alpha-smooth muscle actin (αSMA) to number of HTCFs. Two Images of BATs imbued with HTCFs patients not treated for glaucoma (non-glaucomatous; NG) (A) and patients medically treated for glaucoma (glaucomatous; G) (B) were acquired using a 10x objective of a laser-scanning confocal microscope. Nucleic acids of the HTCFs were stained with DAPI (blue) and the αSMA (green) was stained using Alexa Fluor 488–conjugated primary antibody. ImageJ quantified the number of nuclei and αSMA greater than a threshold of 30 pixels. The area of a BAT that nuclei and αSMA counts were obtained from were identical for a given replicate. The pixel intensity of αSMA was divided by the number of nuclei in four images for each replicate. HTCFs derived from glaucomatous patients expressed greater levels of αSMA than HTCFs collected from non-glaucomatous patients (C). The values were expressed as a mean ±SE from four independent experiments (*P<0.05). Scale bar is approximately 50 μm.
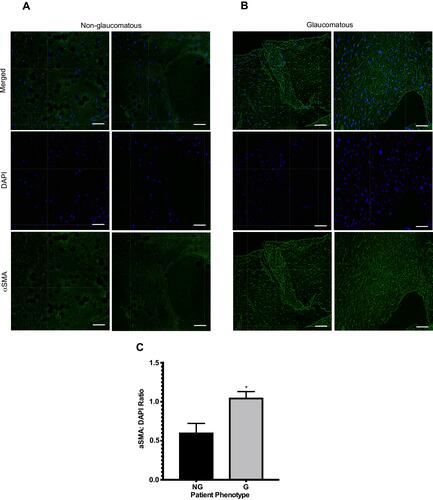
Figure 3 Comparing collagen contraction assays of 3D BATs embedded with HTCFs derived from patients medically treated for glaucoma (glaucomatous; G) and patients not treated for glaucoma (non-glaucomatous; NG). Each collagen gel was populated with 2x10⁵ HTCFs. After a 72 hours incubation period, the collagen was detached from the wells (0 hours) and the area of the collagen disc was measured every 24 hours for 168 hours (A). HTCFs derived from glaucomatous patients contracted the BAT collagen significantly more than HTCFs derived from non-glaucomatous patients at 24–144 hours post-detachment. The values were expressed as a mean ±SE from four independent experiments (*P<0.05, **P<0.01 and ***P<0.001) (B). The area under the curve for the contraction time courses was determined using GraphPad Prism version 7. The area under the curve was significantly less for HTCFs isolated from glaucomatous patients compared to HTCFs isolated from non-glaucomatous patients (C). The values were expressed as a mean ± SE from four independent experiments (**P<0.01).
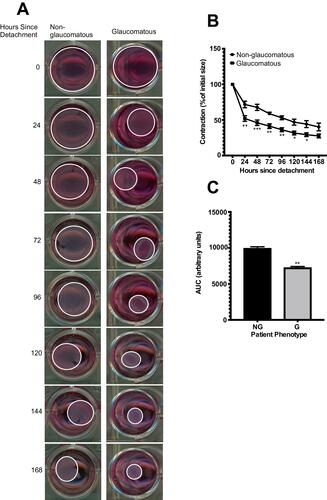
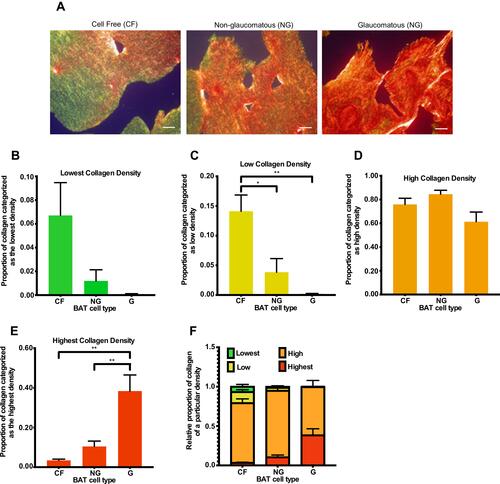
Figure 4 Comparing collagen remodeling in BATs containing no cells (CF) or imbued with HTCFs extracted from patients medically treated for glaucoma (glaucomatous; G) and patients not treated for glaucoma (non-glaucomatous; NG). Images were taken using a 20x objective of an Olympus BX-51 microscope (A) after the cells were imbued 168 hours in the BATs. Pixel density for each color, which corresponded to a particular collagen organization, was quantified using ImageJ. ImageJ analysis revealed that the proportion of green stain (B) in the BATs was not significant between any of the treatments. The proportion of yellow stain (C) in BATs containing HTCFs from glaucomatous and non-glaucomatous patients was significantly lower than the cell free control. The proportion of orange stain (D) in the BATs was not significant between any of the treatments. BATs imbued with HTCFs from glaucomatous patients had a significantly greater proportion of red staining (E) with respect to the non-glaucomatous treatment group. The values were expressed as a mean ±SE from four independent experiments (*P<0.05 and **P<0.01). A schematic representing the proportion of collagen undergoing very low, low, high and very high degrees of remodeling for each experimental condition (F). Scale bar is approximately 20 μm.