Figures & data
Table 1 Patient Characteristics (N = 154, Eye Side = 163)
Table 2 Characteristics of the Three Groups
Table 3 Follow-Up Period and Treatment Outcomes
Figure 1 Postoperative follow-up time of IOP (A) and BCVA (logMAR) (B) between two groups.
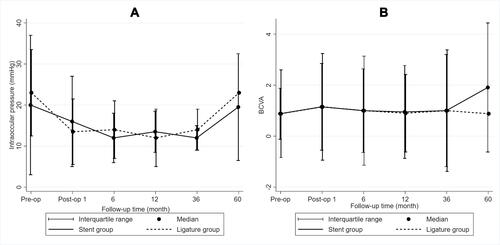
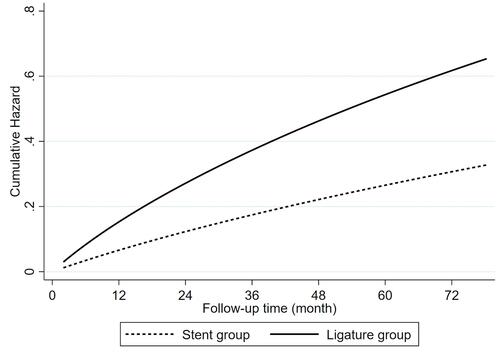
Figure 2 Adjusted parametric cumulative hazard function illustrating treatment failure comparing between the two groups and analysed by mixed-effects exponential proportional hazard regression (P = 0.147).