
Figures & data
Figure 1 The Visiometrics HD Analyzer (image courtesy of Keeler; Malvern, PA) measures the retinal point spread function via a double-pass method, providing an objective measure of forward light scatter and other metrics of visual quality.
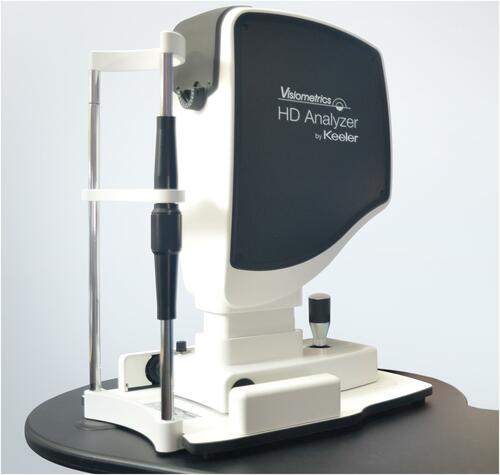
Figure 2 The HD Analyzer uses an infrared laser and a double-pass image through asymmetric entrance and exit apertures captured with a charge-coupled device camera, allowing inference of the complete optical transfer function of the eye as well as the shape of the retinal point spread function.
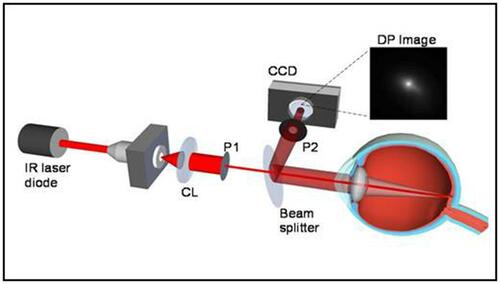
Table 1 Visual Acuity Parameters with YAG Capsulotomy (1 Line Improvement in Acuity = −0.10 log MAR)
Table 2 HD Analyzer Parameters Pre- and Post-YAG Capsulotomy
Figure 3 Preoperative OSI for each subjective PCO grading. Preoperative OSI values were significantly lower for Grade 1 than for both Grade 2 (p=0.0392) and Grade 3 (p=0.0184) and approached statistical significance when comparing values between Group 2 and 3 (p=0.0782).
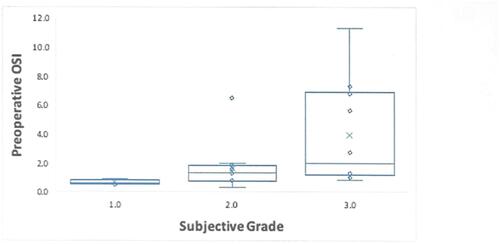
Table 3 Correlations (R2) Between Change in High and Low Contrast Visual Acuity and Objective and Subjective Metrics