Figures & data
Figure 1 Measuring technique: (A) Lower eyelid margin was everted using a cotton bud into a plane perpendicular to the light source. (B) Anterior segment optical coherence tomography (AS-OCT) image showing punctal parameters (outer punctal diameter (OPD), internal punctum and punctal depth (PD)) of a participant in the control group that was measured using anterior segment module of Topcon 3D OCT-2000 ™ (Topcon Medical Systems Inc.).
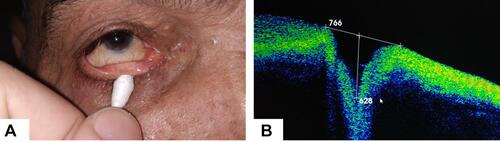
Table 1 Age and Gender Distribution of the Two Studied Groups
Table 2 Comparison of the PEG and the CG Before Treatment Regarding OPD
Figure 2 Epiphora grading by Munk’s score among persistent epiphora group (PEG) before and 1 month after treatment showed significant improvement of epiphora symptoms after treatment.
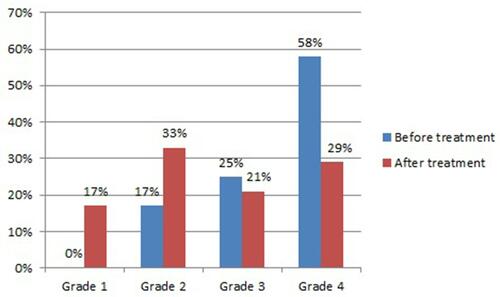
Table 3 Comparison Between Outer Punctal Diameter (OPD) of Persistent Epiphora Group (PEG) Before Treatment and After Treatment
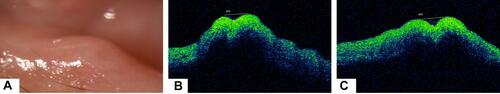
Figure 3 (A and B) Before treatment: Slit lamp examination showed barely visible punctum and stuffed appearance. Anterior segment optical coherence tomography (AS-OCT) image revealed outer punctal diameter (OPD) of 280 µm (white line) with lost punctal depth (PD). (C and D) One month after treatment: Slit lamp examination showed decreased punctal edema with clear visible punctal opening. AS-OCT image revealed increased OPD to 480 µm (white line) and restoration of the PD (yellow line) associated with marked clinical improvement.
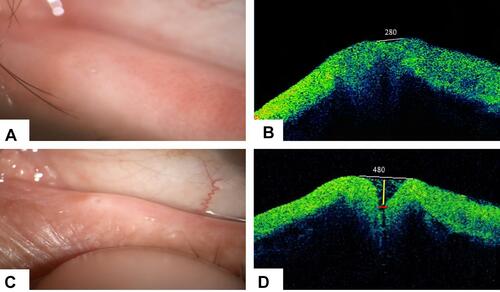
Figure 4 (A and B) Before treatment: Slit lamp examination showed barely visible punctum. Anterior segment optical coherence tomography (AS-OCT) image revealed outer punctal diameter (OPD) of 443 µm (white line) with very shallow punctal depth (PD). (C) One month after treatment: AS-OCT image revealed minimal increase of OPD to 490 µm (white line) meanwhile neither vertical canaliculus lumen nor inner punctal opening was restored.