
Figures & data
Table 1 Patient Baseline Characteristics
Figure 1 Comparison of final visual acuity between baseline groups.
Notes: Figure 1 shows a boxplot comparison of final visual acuity, as measured by the LogMAR scale, between the three baseline groups. p-value (good vs intermediate) = < 0.001. p-value (good vs poor) = < 0.001. *The final visual acuity of those in the good initial visual acuity group was significantly higher than those in the intermediate initial visual acuity group. †The final visual acuity of those in the intermediate initial visual acuity group was significantly higher than those in the poor initial visual acuity group.
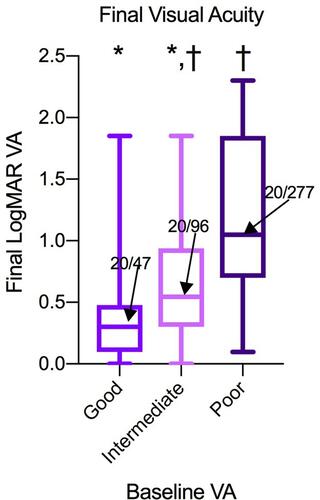
Figure 2 Comparison of final visual acuity rank between baseline groups.
Notes: Figure 2 shows the proportion of eyes with good, intermediate, and poor visual outcomes, compared across all three baseline groups. Eyes with good initial visual acuity tended to have the highest proportion of good visual outcomes, whereas eyes with poor initial visual acuity tended to have the highest proportion of poor visual outcomes. p-value = < 0.001.
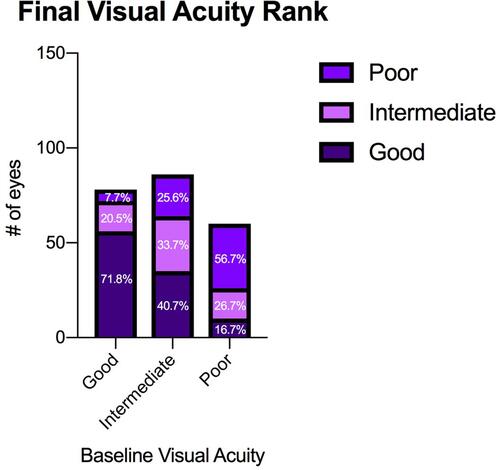
Figure 3 Comparison of change in visual acuity between baseline groups.
Notes: Figure 3 shows a boxplot comparison of change in visual acuity, as measured by the LogMAR scale, between the three baseline groups. *The gain in visual acuity of those in the poor initial visual acuity group was significantly higher than those in either the good or intermediate initial visual acuity groups.
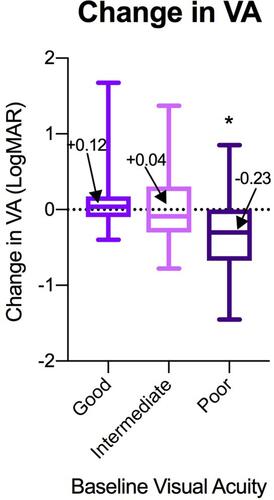
Figure 4 Comparison of change in visual acuity rank between baseline groups.
Notes: Figure 4 shows the proportion of eyes that gained, lost, or had unchanged visual acuity. Eyes with poor initial visual acuity tended to have the highest proportion of gained visual acuity. On the other hand, eyes with good initial visual acuity tended to have the highest proportion of unchanged visual acuity.
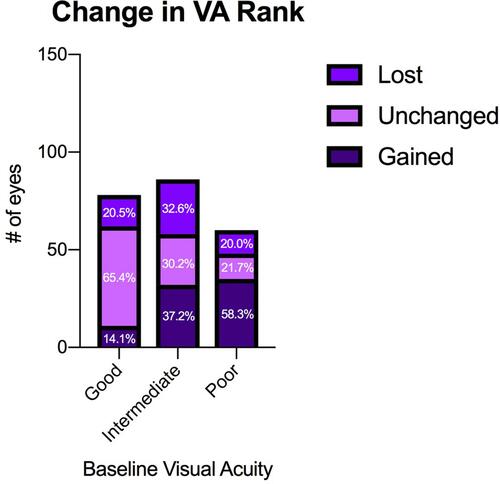
Figure 5 Comparison of OCT outcomes between baseline groups.
Notes: Figure 5 shows the proportion of patients with dry OCT outcomes, compared across all three baseline groups. *A significantly greater proportion of eyes with good initial visual acuity had dry OCT outcomes than those with intermediate or poor initial visual acuity.
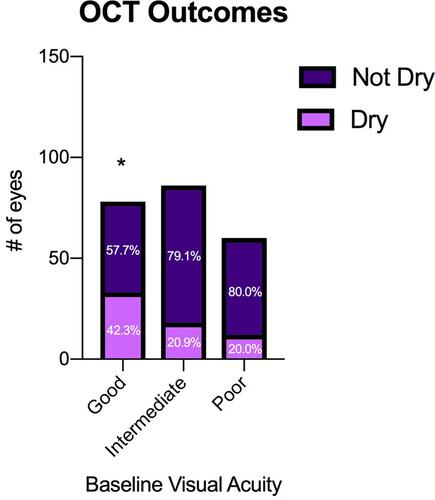
Table 2 Comparison of Treatment Days and Number of Injections Between Baseline Groups