Figures & data
Figure 1 Pentacam nucleus staging (PNS).
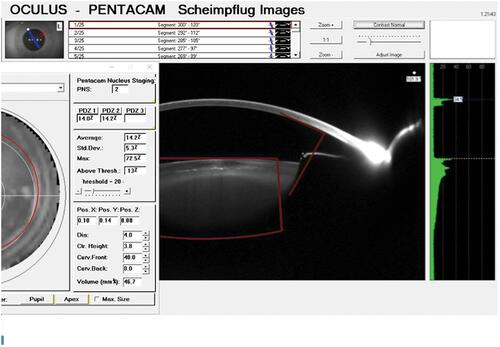
Figure 2 Lens fragmentation used in all cases in the FLACS group: sextants with lens softening, grid spacing 350 µm, seg-soft spacing 200 µm.
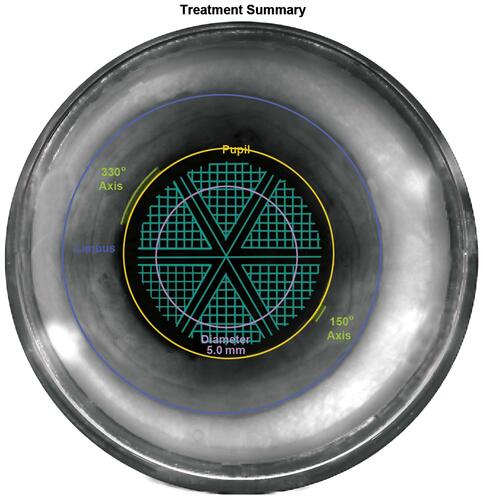
Table 1 Age differences among cases in FLACS and CPS groups and their subgroups
Table 2 Intraoperative parameters in FLACS and CPS groups
Table 3 Intraoperative parameters in FLACS and CPS subgroups
Figure 3 Anterior-segment axial scan by spectral-domain OCT of Catalys precision-laser system. Dense cataracts were noticed to extend posteriorly beyond the minimum laser-fragmentation offset of 500 μm from the posterior capsule.
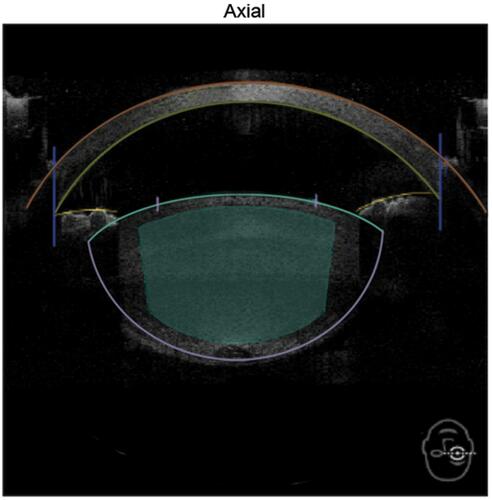
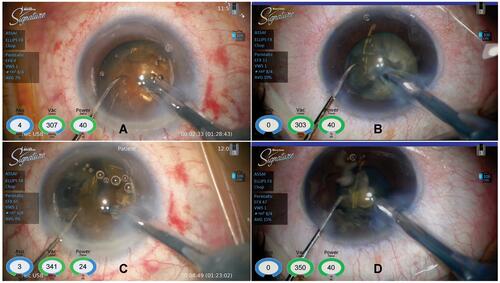
Figure 4 Dense (brunescent) cataract subgroup C. Nucleus-cracking phase. Similar US-energy levels were utilized in FLACS (A) and CPS (B). During quadrant removal, less US energy was utilized in the FLACS (C) than the CPS (D) subgroups.