
Figures & data
Figure 1 Study protocol. The figures of excluded subjects due to missing or non-suitable exams resulted from data that had been collected in clinical practice and had errors not compatible with research purposes. In seven eyes, upon placement of the ICL with the haptics oriented horizontally the lenses were rotated to the vertical meridian due to excessive vaulting.
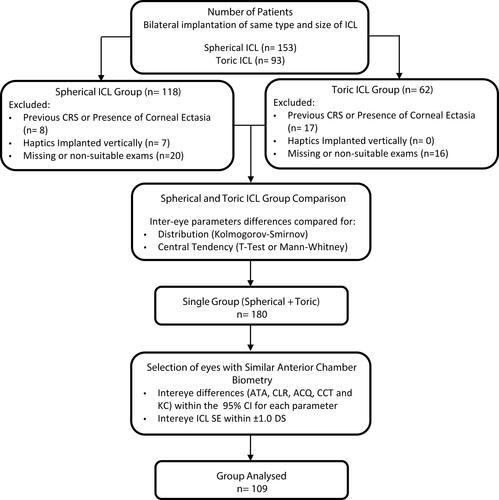
Figure 2 (A) Preoperative measurements for the right and left eye using the AS-OCT chamber calliper. (B) Postoperative measurements Vault and Pupil diameter using linear callipers.
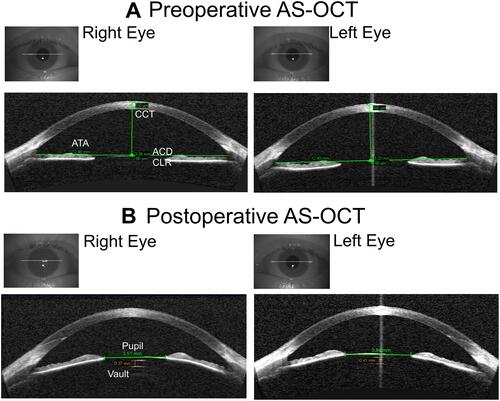
Table 1 Sample’s Demographic Summary After Similarity Control Between Fellow Eyes (n=109). The Values are Represented by the Mean, Standard Deviation and Range
Table 2 Pre- and Postoperative Anatomical and Lens Parameters After Control Between Fellow Eyes (n=109). Right Eye, Left Eye and Inter-Eye Differences (ΔE) Represented by the Mean, Standard Deviation and Range; Intraclass Correlation Coefficient (ICC) Presented with 95% Confidence Intervals
Figure 3 (A) Bland-Altman plot, continuous line represents the mean inter-eye vault difference and the dashed line the limits of the 95% CI of the inter-eye differences. (B) Histogram of the inter-eye vault differences.
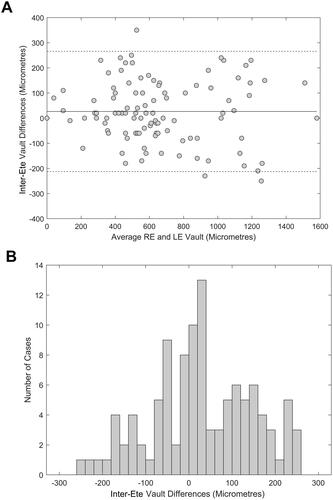
Figure 4 Association between average horizontal compression (HC= ICL Size – ATA) and absolute inter-eye vault differences.
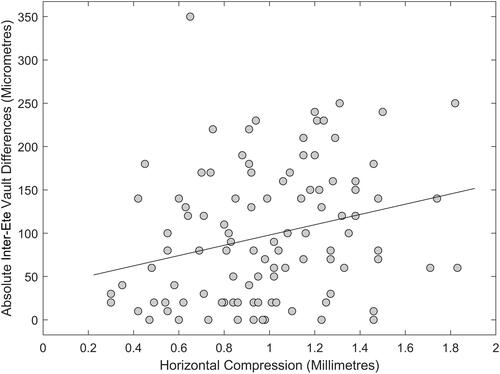
Figure 5 Absolute inter-eye vault differences for all cases and divided in three vault ranges (average RE and LE vault) groups, low: <250 µm, intermediate: [250, 750] µm and high >750 µm. Box edges represent the limits of the 25% and 75% quartile, lines inside the boxes represent the median and the whiskers the 2.5 and 97.5% percentiles.
![Figure 5 Absolute inter-eye vault differences for all cases and divided in three vault ranges (average RE and LE vault) groups, low: <250 µm, intermediate: [250, 750] µm and high >750 µm. Box edges represent the limits of the 25% and 75% quartile, lines inside the boxes represent the median and the whiskers the 2.5 and 97.5% percentiles.](/cms/asset/34497ae7-2b9e-4f98-946a-3383fcc67917/doph_a_12176814_f0005_b.jpg)
Table 3 Cumulative Percentage of Absolute Inter-Eye Vault Differences. Considering (Average RE and LE Vault) Low Vault <250, Intermediate 250 to 750 µm and High Vault >750 µm