Figures & data
Table 1 Demographic Data of Study Patients
Figure 1 Change in VAS scores. Mean VAS score differences across all patients and between time points, pre-treatment vs 2–3 week (p<0.001); pre-treatment vs 1-day (p<0.001); 1-day vs 2–3 week (p= 0.028).
![Figure 1 Change in VAS scores. Mean VAS score differences across all patients and between time points, pre-treatment vs 2–3 week (p<0.001); pre-treatment vs 1-day (p<0.001); 1-day vs 2–3 week (p= 0.028).](/cms/asset/5812d137-3899-454a-b7d8-c54573b6dd9b/doph_a_12176817_f0001_c.jpg)
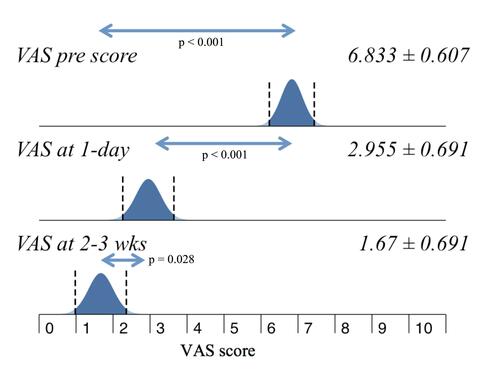
Table 2 VAS Score Sub-Analysis
Figure 2 VAS scores by subject group. VAS scores over time for subjects in the at-risk (A) and conversion (B) groups.
![Figure 2 VAS scores by subject group. VAS scores over time for subjects in the at-risk (A) and conversion (B) groups.](/cms/asset/cfb3c958-d86c-4f75-9b66-f766102c314d/doph_a_12176817_f0002_c.jpg)
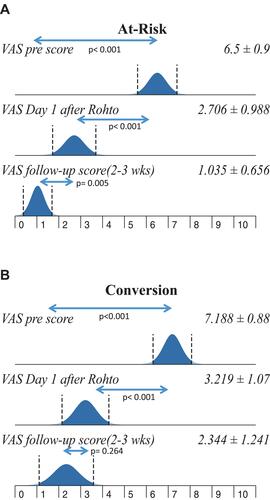
Table 3 Ingredients in Rohto Dry-Aid†