Figures & data
Figure 1 Study design.
Abbreviations: IL, interleukin; PAS, periodic acid Schiff.
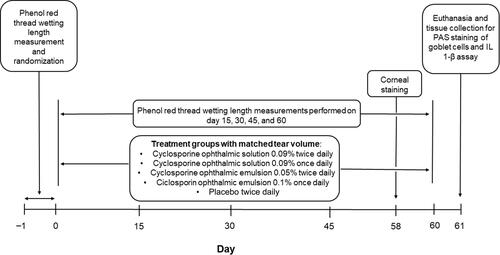
Table 1 Phenol Red-Impregnated Thread Wetting Length (mm) in Both Eyes from Baseline to Day 60
Figure 2 Change from baseline in tear production through 60 days of treatment.
Notes: # P <0.05, ## P <0.01 vs cyclosporine ophthalmic emulsion 0.05%; † P <0.05, †† P <0.01, ††† P <0.001 vs NOD diseased control; § P <0.05, §§ P <0.01, §§§ P <0.001 vs placebo.
Abbreviation: NOD, NOD.B10.H2b.
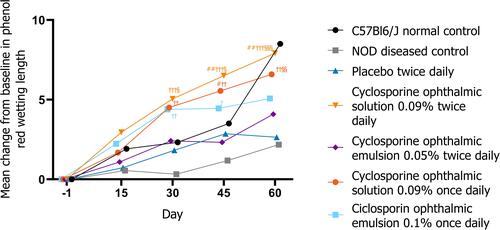
Figure 3 Representative periodic acid Schiff stained conjunctival goblet cells (100x magnification) at day 60.
Abbreviation: NOD, NOD.B10.H2b.
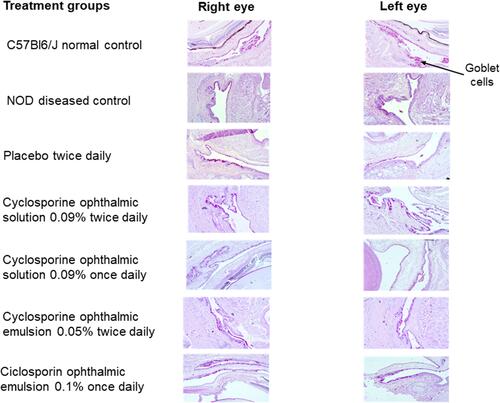
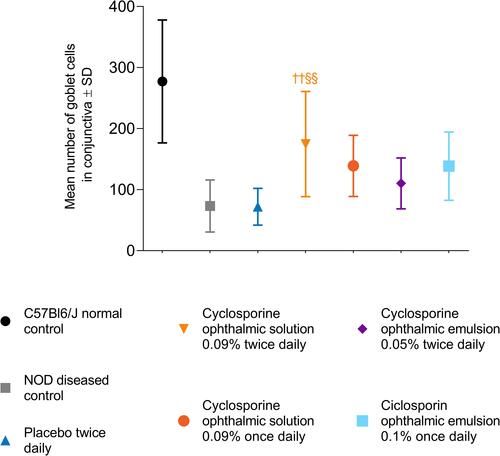
Figure 4 Total number of goblet cells in the conjunctiva at day 60.
Notes: †† P <0.01 vs NOD diseased control; §§ P <0.01 vs placebo.
Abbreviations: NOD, NOD.B10.H2b; SD, standard deviation.