Figures & data
Figure 1 (A and B) Color fundus photograph montages showing disk edema, diffuse retinal whitening, and retinal hemorrhages more prominent in the left eye compared to the right eye. (C) Optical coherence tomography showing atrophy of the temporal retina and disruption of inner segment–outer segment junction of the photoreceptor in the right eye. (D) Optical coherence tomography revealing edema of the nasal macula and central foveal hyper-reflectivity consistent with a scar in the left eye. (E) Optical coherence tomography thickness map of the right eye demonstrating temporal thinning.
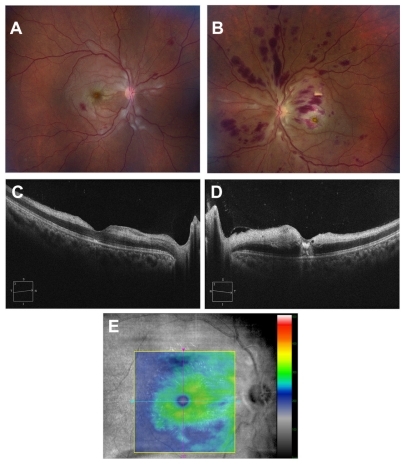
Figure 2 (A) Color photograph and (B) fluorescein angiogram of the right eye 1 month after presentation.
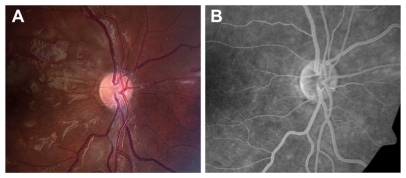
Figure 3 (A) Color photograph of the left eye 1 month after presentation revealing neovascularization of the disk. (B, C and D) Early, mid, and late fluorescein angiograms of the left eye at the same visit demonstrating leakage of the disk consistent with neovascularization. (E) Fluorescein angiogram of the mid-periphery revealing ischemia superonasal to the disk.
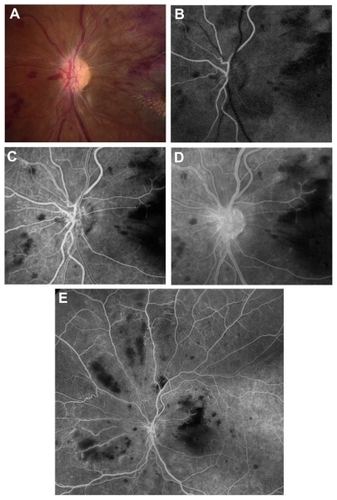
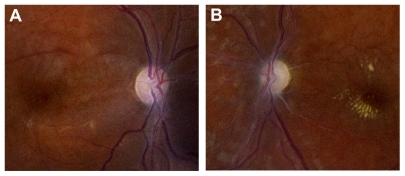
Figure 4 Color photographs of the right (A) and left (B) eyes 5 months after pan-retinal photocoagulation, demonstrating regression of neovascularization of the disk. Optic atrophy and pallor are present.