
Figures & data
Figure 1 Measurement of subretinal fluid height (upper left), lesion size (upper right) and central macular thickness (lower).
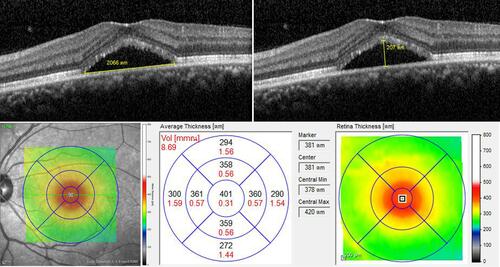
Table 1 Demographic Data and Clinical Characteristics
Table 2 Comparison of Eyes with Complete Resolution of SRF in Both Groups
Figure 2 Kaplan–Meier survival estimates over 6-month follow up of patients in both groups. Cox regression test: p = 0.032, HR = 0.42, 95% CI (0.19, 0.93).
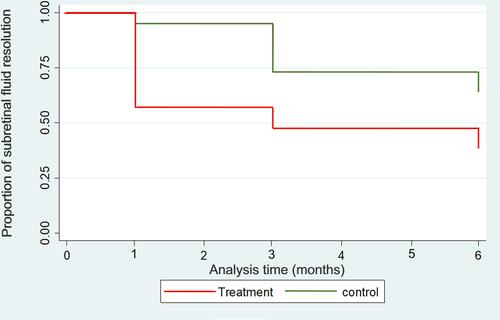
Table 3 Secondary Outcomes Measured at Baseline, 1 Month, 3 Months and 6 Months
Table 4 Secondary Outcome Changes from Baseline to 6 Months in Both Groups
Figure 3 Changes in subretinal fluid height (upper left), central macular thickness (upper right), lesion size (lower left) and best-corrected visual acuity (lower right) over 6-month follow-up period.
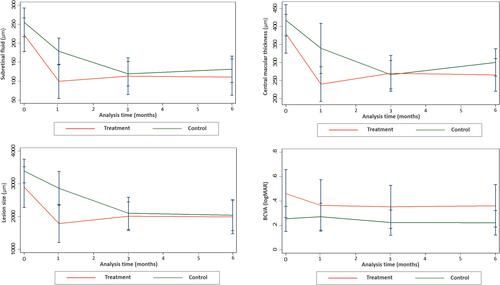
Table 5 Multivariate Analysis of Factors Associated with the Complete Resolution of SRF