Figures & data
Box 1 Preoperative Clinical Metrics
Box 2 Postoperative Clinical Metrics
Table 1 Patient Satisfaction Survey
Table 2 Demographic Characteristics
Table 3 Results of Subjective Patient Questionnaire
Figure 1 +4.00/+4.00 Multivariate Regression.
Figure 2 +4.00/+4.00 Multivariate Regression.
Figure 3 +3.25/+3.25 Multiple Regression Analysis.
Figure 4 EDOF/+3.25 Multiple Regression Analysis.
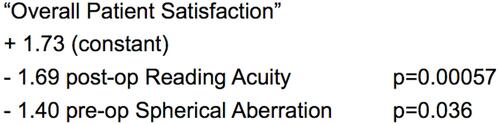
Figure 5 EDOF/+3.25 vs +3.25/+3.25 vs +4.00/+4.00.
Notes: †Scores: +2 None of the time; +1 Some of the time; 0 Half of the time; −1 Most of the time; −2 All of the time. *Significantly in favor of +3.25/+3.25 vs +3.25/EDOF. §Significantly in favor of +4.00/+4.00 vs +3.25/EDOF.
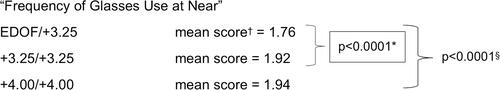
Figure 6 EDOF/+3.25 vs +3.25/+3.25 vs +4.00/+4.00.
Notes: †Scores: 5 Excellent; 4 Very Good; 3 Good; 2 Fair; 1 Poor. *Significantly in favor of EDOF/+3.25 vs +3.25/+3.25. §Significantly in favor of EDOF/+3.25 vs +4.00/+4.00.
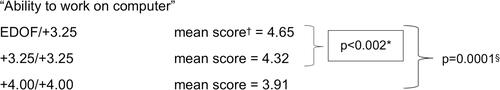
Figure 7 EDOF/+3.25 vs +3.25/+3.25 vs +4.00/+4.00.
Notes: *EDOF/+3.25 significantly better vs +3.25/+3.25 and +4.00/+4.00.
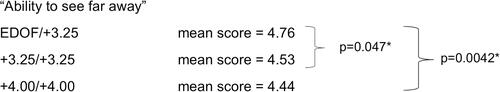
Table 4 Comparison of Outcomes Between Cohorts
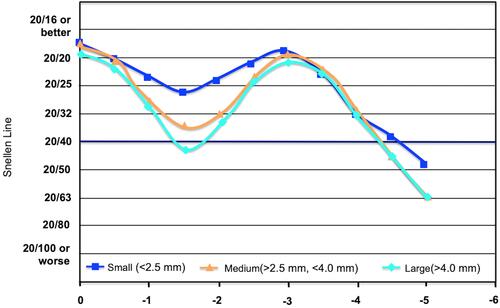
Figure 8 TECNIS® Multifocal 1-Piece Defocus Curve.