551
Views
11
CrossRef citations to date
0
Altmetric
Review

The Evolution of Diabetic Retinopathy Screening Programmes: A Chronology of Retinal Photography from 35 mm Slides to Artificial Intelligence

ORCID Icon, ORCID Icon & ORCID Icon
Pages 2021-2035 | Published online: 20 Jul 2020

Figures & data

Table 1 Selected Population Screenings and Selected Regional Screening Programs

Figure 1 Timeline bubble chart displaying selected regional screenings with either synchronous (green) or asynchronous (blue) reporting of screening outcomes. The bubble diameter is an approximation of the number of screened patients with diabetes per annum (yellow), references can be found in .

Figure 1 Timeline bubble chart displaying selected regional screenings with either synchronous (green) or asynchronous (blue) reporting of screening outcomes. The bubble diameter is an approximation of the number of screened patients with diabetes per annum (yellow), references can be found in Table 1.

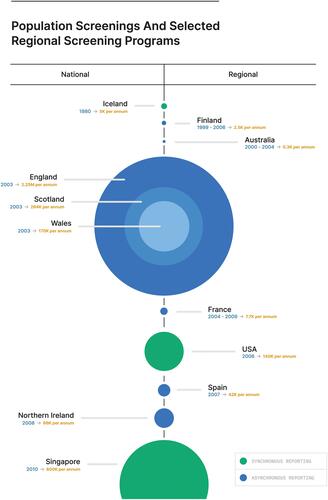
Table 2 Overview of Selected Diabetic Retinopathy Clinical Decision Support Systems